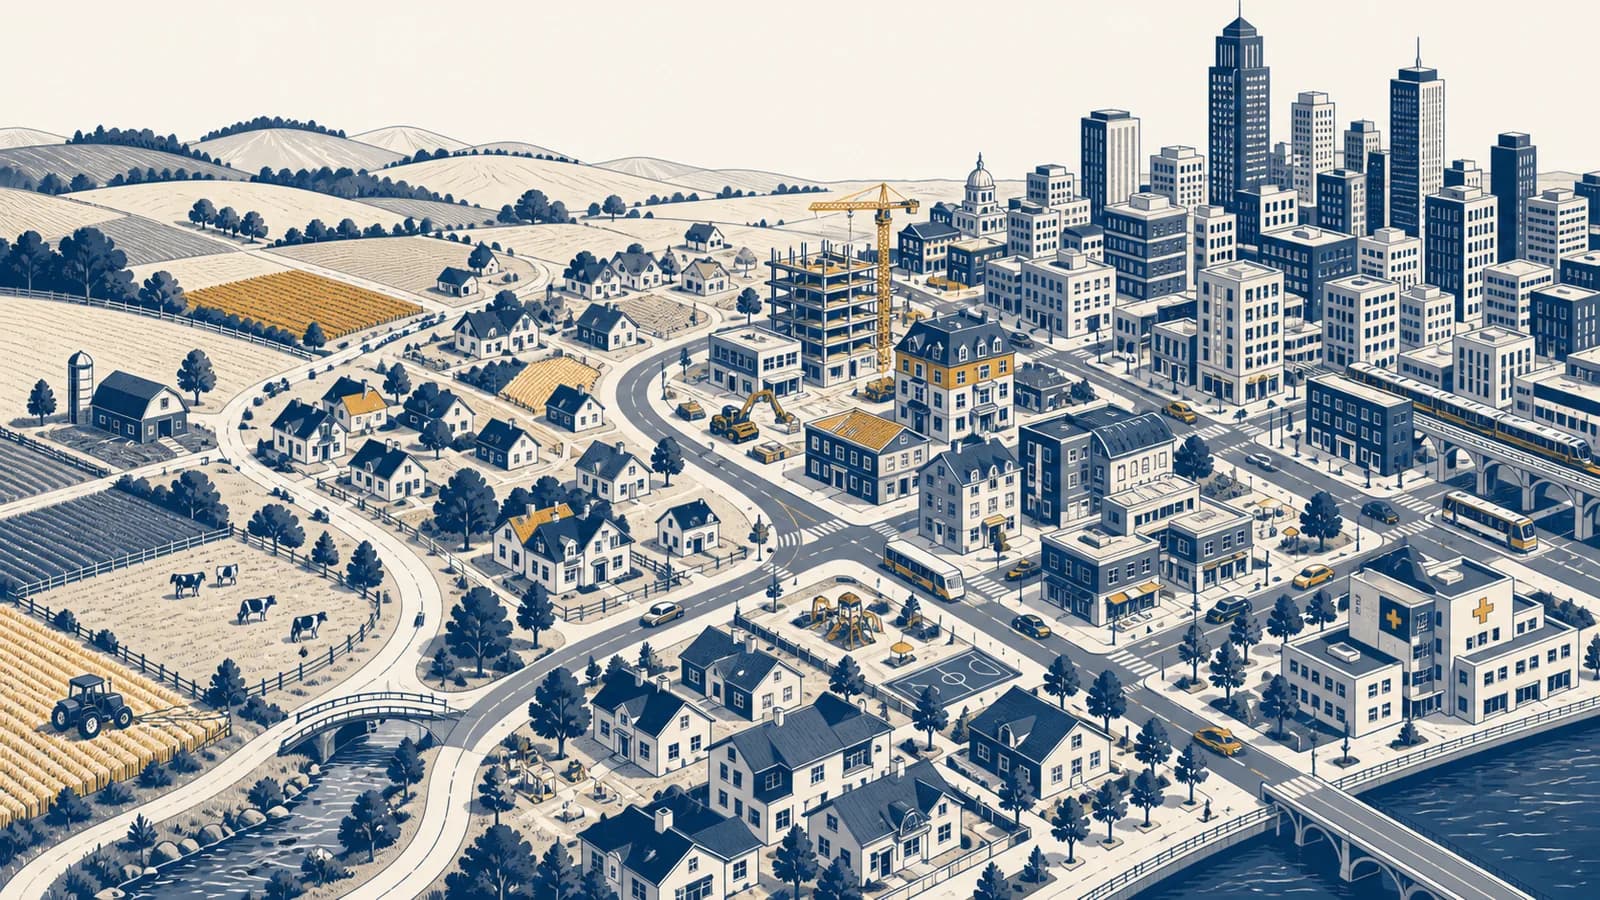
Rural and urban development is a process that changes settlements, economies, services, land use, and living conditions, in the context of human geography. It explains how villages, towns, and cities grow or decline, why rural development and urban development follow different paths, and how planning can improve access to work, housing, transport, education, health care, water, and sanitation. The idea exists because where people live affects which opportunities they can reach and which costs they must bear.
A settlement does not develop simply because more buildings appear. A new road can connect farmers to buyers, but it can also raise land prices. A factory can create wages, yet pollute a river used downstream. A housing project can reduce overcrowding, but fail if residents cannot reach jobs. Development therefore means tracing connected changes and asking who gains, who pays, and what happens next.
What rural and urban development actually is
Rural and urban development is the planned and unplanned transformation of places where people live. It includes changes in population, jobs, infrastructure, public services, land values, buildings, environmental conditions, and links between settlements, rather than growth in population or income alone.
Rural areas usually have lower population density, greater distances between services, and a larger share of land devoted to farming, forestry, conservation, mining, or other land based activities. Urban areas concentrate people, buildings, businesses, public institutions, and transport networks. These are useful descriptions, not universal boundaries. Each country may classify settlements by its own population threshold, administrative status, density, or economic character.
Development has several dimensions. Economic development changes jobs, production, incomes, and markets. Social development changes access to education, health care, safety, and political voice. Physical development changes roads, housing, energy systems, drainage, and communications. Environmental development protects or restores soil, water, air, habitats, and resilience to hazards. A project can improve one dimension while damaging another.
A town adds people, homes, shops, traffic, and total economic output. These are increases in amount.
People gain reliable services, safer housing, useful skills, better access to work, and a healthier environment. These are changes in capability and living conditions.
The distinction matters because rapid growth can occur without broad development. If a city population rises faster than water pipes, homes, schools, and transport capacity can be provided, the city grows while many residents experience worsening conditions.
How rural development works
Rural development works by reducing the penalties of distance, weak market access, limited services, and dependence on a narrow range of livelihoods. Effective action links local production, infrastructure, skills, finance, institutions, and resource management so that each investment supports the others.
Consider a farming district where growers sell perishable vegetables. A paved feeder road lowers vehicle damage and makes travel possible after heavy rain. A collection centre lets farmers combine small loads. Cold storage extends the time before produce spoils. Mobile price information improves bargaining. A cooperative may share equipment or negotiate with wholesalers. None of these changes guarantees success by itself, but together they alter what can be produced and where it can be sold.
The same chain applies to services. A clinic needs a building, but it also needs trained staff, medicine deliveries, power, clean water, communications, and roads patients can use. Building the clinic without funding those connections creates a facility on a map, not dependable health care.
Economic diversification reduces exposure to one shock
Economic diversification means building several sources of work and income within a local economy. A district dependent on one crop is exposed to crop disease, drought, and price falls. Food processing, repair services, tourism, renewable energy, construction, remote work, and small manufacturing can spread risk where local conditions support them.
Diversification is not a command to abandon agriculture. Processing milk into cheese, fruit into preserves, or timber into furniture can retain more value near the place of production. Training and credit matter because a machine is useful only when people can operate, repair, finance, and supply it.
Land and natural resources set real limits
Rural development depends on the condition and control of land, water, forests, fisheries, and minerals. Unclear land rights can discourage long term investment or allow powerful buyers to displace customary users. Excessive irrigation can deplete groundwater. A road into a forest can improve access while accelerating clearance.
An infrastructure project changes incentives. A road does more than shorten a trip. It changes land values, extraction costs, migration choices, and the locations businesses consider profitable.
This is why project assessment must examine indirect effects. The visible structure is often only the first link in a longer geographic chain.
How urban development works
Urban development works through concentration: people and firms share labour markets, suppliers, customers, services, and infrastructure. Concentration can raise productivity and widen choice, but it also creates congestion, expensive land, pollution, overcrowding, and heavy demand for coordinated planning and public investment.
Urban concentration creates agglomeration economies. A hospital can recruit specialised workers from a large labour pool. A manufacturer can buy from nearby suppliers. A restaurant can draw customers from offices, homes, and transport stations. Workers can change employers without moving house. Knowledge spreads through repeated contact and job movement.
The gains are not automatic. When thousands of households compete for well located land, prices rise. If legal housing supply cannot respond, people may crowd into existing homes, settle far from work, or build where tenure and services are insecure. When road space is free at the busiest time, each extra car adds delay for others. When drainage is blocked or undersized, a paved city can turn intense rain into fast surface runoff.
Jobs, education, safety, family links, and services attract people, while businesses seek workers and customers.
Homes, shops, roads, transit, water, power, schools, and waste systems face more users.
Central land becomes expensive, dense construction becomes more attractive, and some development moves outward.
Zoning, taxes, infrastructure, service budgets, and housing rules influence who can build, where, and at what cost.
These feedbacks explain why a city is not simply a large village. Density makes high capacity public transport and specialised hospitals possible, yet the same density requires shared rules for noise, fire safety, waste, construction, and street use. The geography of where people cluster and how density is measured helps separate crowded living conditions from density itself. A dense neighbourhood can be spacious and healthy if homes, public space, and infrastructure are designed for its population.
Rural development versus urban development
Rural and urban development address different spatial conditions, but they are not opposing projects. Rural policy often tackles distance and sparse demand, while urban policy manages concentration and competition for land. Both depend on connections, capable institutions, and fair access to opportunity.
| Feature | Rural setting | Urban setting |
|---|---|---|
| Common spatial problem | Long distances and scattered users | Congestion and competing land uses |
| Typical network challenge | High service cost per user | High demand on limited capacity |
| Livelihood pattern | Often tied closely to land and natural resources | Often concentrated in industry and services |
| Housing pressure | Quality, finance, tenure, and access to services | Price, crowding, location, supply, and tenure |
| Transport problem | Reaching distant markets and facilities | Moving many people through busy corridors |
| Environmental risk | Soil loss, water stress, habitat damage, and resource depletion | Air pollution, heat, runoff, waste, and exposure in dense districts |
The categories also overlap. A village beside a metropolitan highway may supply commuters and warehouses. A small town can serve as a market, school centre, and hospital centre for a large rural hinterland. A city's water, food, energy, building materials, and waste sites often come from outside its boundary. The study of how work, resources, and trade are arranged across space shows why a decision in one settlement can shift costs or income to another.
Peri-urban areas make the overlap visible. These are zones around cities where farms, subdivisions, workshops, warehouses, roads, and undeveloped land mix rapidly. Administrative boundaries may lag behind actual growth. Residents can face urban land prices without urban services, while farmers face uncertainty about future land use.
Those flows include commuters, remittances, food, water, electricity, investment, information, waste, and political influence. Treating the city and countryside as sealed containers hides the mechanism.
How planners measure development without mistaking one number for the whole
Planners measure development with several indicators because no single figure captures living conditions, access, economic security, environmental quality, and distribution. Useful measures have a clear definition, a suitable geographic scale, a comparison over time, and enough detail to show who is excluded.
Total income can rise because a mine opens, even if profits leave the district and local water quality falls. Average travel time can improve while one outlying village loses its bus. The number of homes can increase while rents consume a larger share of low incomes. Measurement must therefore connect an output to an outcome.
- Outputs are things delivered, such as kilometres of pipe, classrooms built, buses purchased, or land titles processed.
- Outcomes are changes people experience, such as safer water, shorter reliable trips, improved attendance, or more secure occupation of land.
- Distribution asks how those changes differ by neighbourhood, income, age, disability, gender, occupation, or tenure.
- Durability asks if the service can be maintained after construction funds end.
A district with 48,000 residents across 60 square kilometres has an average density of 800 residents per square kilometre.
That calculation is checkable, but its interpretation requires care. The district may contain an uninhabited wetland and one compact settlement, so average density does not describe every part. The boundary chosen also changes the result. A neighbourhood measure can reveal conditions hidden by a citywide average.
Accessibility can be more revealing than distance. A clinic five kilometres away may be inaccessible if a river crossing fails in rain, the road is unsafe to walk, or appointment times do not match the bus. A useful accessibility measure specifies the destination, travel mode, time of day, cost, and reliability.
How migration and land markets reshape settlements
Migration and land markets reshape settlements by moving people, demand, labour, and investment between places. People respond to jobs, education, safety, family ties, housing costs, services, and environmental pressure, while landowners and developers respond to expected rents, rules, and infrastructure.
Rural to urban migration is one important flow, but it is not the only one. People move between villages, between cities, outward to suburbs, seasonally for farm work, and back to home regions. Some households split across several places. A worker may earn in a city while relatives farm in a village, with money and care moving in both directions.
Migration changes both origin and destination. The destination gains workers, consumers, skills, and cultural connections, but housing and services may face pressure. The origin may lose working age residents, yet receive remittances, knowledge, business contacts, or returning migrants. Effects differ by household and over time, so “migration helps” and “migration harms” are both incomplete claims.
Land markets translate expectations into prices. Announce a new railway station, and buyers may bid up nearby plots before construction begins. Restrict apartment construction in a high demand area, and the limited supply may become more expensive. Extend a road at the urban edge, and distant land may become profitable to develop. These price changes can fund investment for owners while displacing tenants or users without formal title.
A family rents near a new employment centre. The centre creates work and attracts shops, but nearby rents rise. The family gains a shorter commute only if its income or housing protection lets it remain. To judge the project, track jobs, travel, rents, evictions, and replacement housing together.
Settlement form records these pressures. Compact growth, ribbon development along roads, scattered housing, planned suburbs, and informal subdivisions each produce different costs for pipes, buses, emergency response, farmland, and household travel. The guide to why homes and services form clustered, linear, or dispersed patterns develops that spatial evidence further.
How rural and urban development shows up in public decisions
Rural and urban development appears in public decisions about land use, housing, transport, utilities, schools, health facilities, environmental protection, and local budgets. Each decision allocates access and risk across space, even when it is presented as a technical matter.
A transport route distributes time and opportunity
A transport agency chooses more than a line on a map. Stop spacing affects who can walk to service. Frequency affects waiting. Fares affect affordability. Operating hours affect shift workers. Road design affects injuries, noise, and local air pollution. A route can connect a village to a regional hospital or cut an urban neighbourhood off from its waterfront.
A common appraisal compares construction and operating costs with benefits such as time savings and safer travel. The assumptions deserve inspection. Saving ten minutes for thousands of passengers may outweigh a larger saving for a few motorists, but only if the analysis counts both groups correctly. Unpaid trips for care and household work also belong in the travel picture.
Housing policy changes supply, location, and security
Housing development is the production, improvement, allocation, and maintenance of places to live. Planning permission affects how much can be built. Building codes set safety and health standards. Subsidies influence who can afford a home. Tenant law and land tenure affect security. Infrastructure determines whether a house has water, sanitation, power, and access.
Demolishing an unsafe settlement without nearby replacement housing can move residents farther from work and school. Upgrading drainage, paths, toilets, lighting, and tenure in place may preserve social networks, though it may be unsuitable on land exposed to an unavoidable hazard. The physical risk, resident priorities, legal position, and alternative sites must be assessed together.
Utility networks reveal the cost of spatial form
Water, sewerage, electricity, broadband, and waste collection are networked services. Their cost depends partly on distance, terrain, settlement density, and existing capacity. A scattered rural population may require long lines for few users. A dense district may support efficient shared infrastructure, but old pipes can be difficult to replace beneath busy streets.
Maintenance is development. A new pump attracts attention, but budgets for staff, energy, spare parts, inspections, and replacement determine whether water continues to flow.
Public participation improves decisions when residents can influence choices early, understand constraints, and see how evidence was used. A meeting held after the route and budget are fixed is consultation in name only. Local knowledge can identify flood paths, unsafe crossings, customary land uses, and care networks that a standard dataset misses.
How climate risk changes development choices
Climate risk changes development by altering hazards, exposure, and vulnerability. Planning can reduce future loss by steering construction away from danger, strengthening buildings and ecosystems, protecting essential networks, and ensuring that people with the fewest resources can prepare, respond, and recover.
Hazard is the potentially damaging event or process, such as flooding, extreme heat, wildfire, drought, or coastal erosion. Exposure is the presence of people, buildings, crops, and infrastructure where that hazard occurs. Vulnerability is the degree to which they can be harmed. Development choices affect all three, though they rarely control the hazard completely.
A flood becomes more damaging when housing expands onto a floodplain, wetlands are filled, streams are confined, and households lack insurance or savings. Risk can fall through upstream water retention, protected flood storage, warning systems, raised electrical equipment, safe evacuation routes, and limits on new construction in the most dangerous locations. No single measure removes every failure mode.
Rural livelihoods can be highly sensitive to rainfall timing, water availability, crop disease, and soil condition. Responses may include water harvesting, soil cover, crop diversity, adjusted planting dates, drought plans, insurance, and income sources outside farming. The suitable combination depends on local ecology, knowledge, finance, and land rights.
Urban heat illustrates unequal vulnerability. Closely built districts with dark surfaces, little shade, and limited airflow can retain heat. Outdoor workers, older people, infants, and residents who cannot cool their homes face different levels of harm. Trees and reflective materials can help, but cities must also consider drinking water, health alerts, work practices, building design, and power reliability.
Four mistakes people make with rural and urban development
Four common mistakes are treating development as construction, assuming urbanisation ends rural concerns, using averages without distribution, and copying a project without its local conditions. Each mistake removes a relationship that determines who benefits, what persists, and what new problem appears.
1. Treating a finished structure as a finished outcome
A school building does not produce learning by itself. Teachers must be recruited and retained, pupils must reach it safely, materials must arrive, and families must be able to spare children's time. Construction is an input. The outcome depends on the operating system around it.
2. Assuming urbanisation makes rural areas unimportant
Cities still depend on rural and regional systems for food, water, energy, raw materials, recreation, ecosystem functions, and many workers. Rural residents also depend on towns and cities for markets, hospitals, government services, finance, and specialised education. Urbanisation changes these relationships rather than erasing them.
3. Letting an average hide unequal access
A citywide average may combine well served central districts with peripheral districts lacking safe water or frequent buses. Break data into smaller areas and relevant social groups. Then compare need, service quality, affordability, and outcomes, not only the number of facilities.
4. Copying a visible project without its supporting system
A successful market hall may rely on secure land rights, vendor organisations, waste collection, road access, credit, and steady customer demand. Copying only the building can produce empty stalls. Transfer the causal logic only after testing which conditions exist in the new place.
Did the authority build the project it announced?
Who can use it, at what cost, with what result, for how long, and what changed elsewhere?
The better question turns attention from an object to a functioning service. It also makes unintended effects easier to detect.
Can a place be both rural and urban?
A place can contain both rural and urban characteristics because settlement types form a continuum. Peri-urban zones, commuter villages, market towns, and city regions combine dense built areas, farmland, mobile populations, and shared infrastructure, so one label may conceal important variation.
Classification still has practical uses. Governments need boundaries to collect data, allocate funds, and administer services. The problem begins when the category is treated as the place itself. A national threshold may classify a settlement as urban while many residents farm, or classify a fast growing fringe as rural after its land market and commuting pattern have become metropolitan.
For analysis, state the feature being measured. Population density, commuting, land cover, occupation, service access, and administrative status can each produce a different boundary. The right boundary depends on the question.
Does urbanisation always mean development?
Urbanisation does not always mean development. It is an increase in the share of a population living in urban areas, while development concerns capabilities and living conditions. Urbanisation can support productivity and services, yet also occur alongside insecure housing, unemployment, pollution, and exclusion.
The direction of causation can run both ways. Expanding urban industries may pull workers toward cities. Rural hardship, conflict, land loss, or environmental stress may push people out even when urban jobs and housing are scarce. Natural population increase within cities can also raise the urban share.
Judge the result with outcomes: reliable water, safe housing, attainable work, affordable travel, education, health, security, environmental quality, and political voice. A skyline records investment, but it does not report how a cleaner, street vendor, child, landlord, or displaced tenant experiences the city.
Who decides what development a place gets?
Development is decided through bargaining among governments, residents, landowners, businesses, lenders, utilities, community organisations, and professional planners. Their influence is unequal, and formal approval is only one part of the process because prices, customs, protests, and informal building also shape places.
National government may set housing law, environmental rules, taxation, and major infrastructure budgets. Local government may control land use, streets, waste, and building permission. Utilities decide network extensions. Banks decide which borrowers and projects receive finance. Landowners choose whether to sell or build. Residents organise, vote, object, negotiate, and construct homes or businesses themselves.
Power becomes geographic when one group can place an unwanted facility near another group, reserve valuable land for limited users, or direct investment toward its own district. Studying decision power alongside maps is part of human geography because location and authority continually shape each other.
When a council proposes a waste site, map who produces the waste, who gains from the service, who lives near truck routes, who owns the proposed land, and who participated before the shortlist was written. The map will not decide the case, but it will make the distribution visible.
Good decisions expose tradeoffs and allow revision. They publish assumptions, compare alternatives, test effects on different groups, and establish who will monitor results. Accountability matters after approval because actual behaviour may differ from a forecast.
Rural and urban development makes geography visible in daily life
Rural and urban development shows that geography is the study of connected places, flows, environments, and decisions. A bus timetable, rent rise, water interruption, new bypass, field boundary, or planning notice reveals how location and power shape ordinary opportunity.
To analyse a change near you, begin with a map and a causal chain. Mark the project or problem, the people and resources connected to it, and the relevant boundaries. Record conditions before the change. Then follow movement: who travels, what flows, where costs appear, and which alternative locations were possible.
Next, compare scales. A bypass may reduce traffic on one main street while increasing development pressure near a rural interchange. A dam may supply a distant city while changing farms and ecosystems upstream. A protected green space may benefit a whole region while nearby residents bear limits on construction. The same decision can look different at household, neighbourhood, municipal, and regional scales.
This hypothetical 100 unit budget illustrates a check, not a universal allocation. If every unit goes to construction, the project may lack staff, maintenance, connecting paths, affordability support, or monitoring. A geographic analysis asks how the complete service reaches people over time.
Development is best read as a set of relationships: between a home and a job, a farm and a market, a drain and a river, a tax base and a service, a local decision and a regional effect. You can place those relationships within the wider set of geography ideas and applications, then use them to question any plan that treats a place as an empty site.
The takeaway: Look past the new building or headline figure. Trace access, maintenance, land, movement, environmental effects, decision power, and distribution. Development is working only when the connected system improves people's real choices without shifting hidden costs onto another place or a later generation.