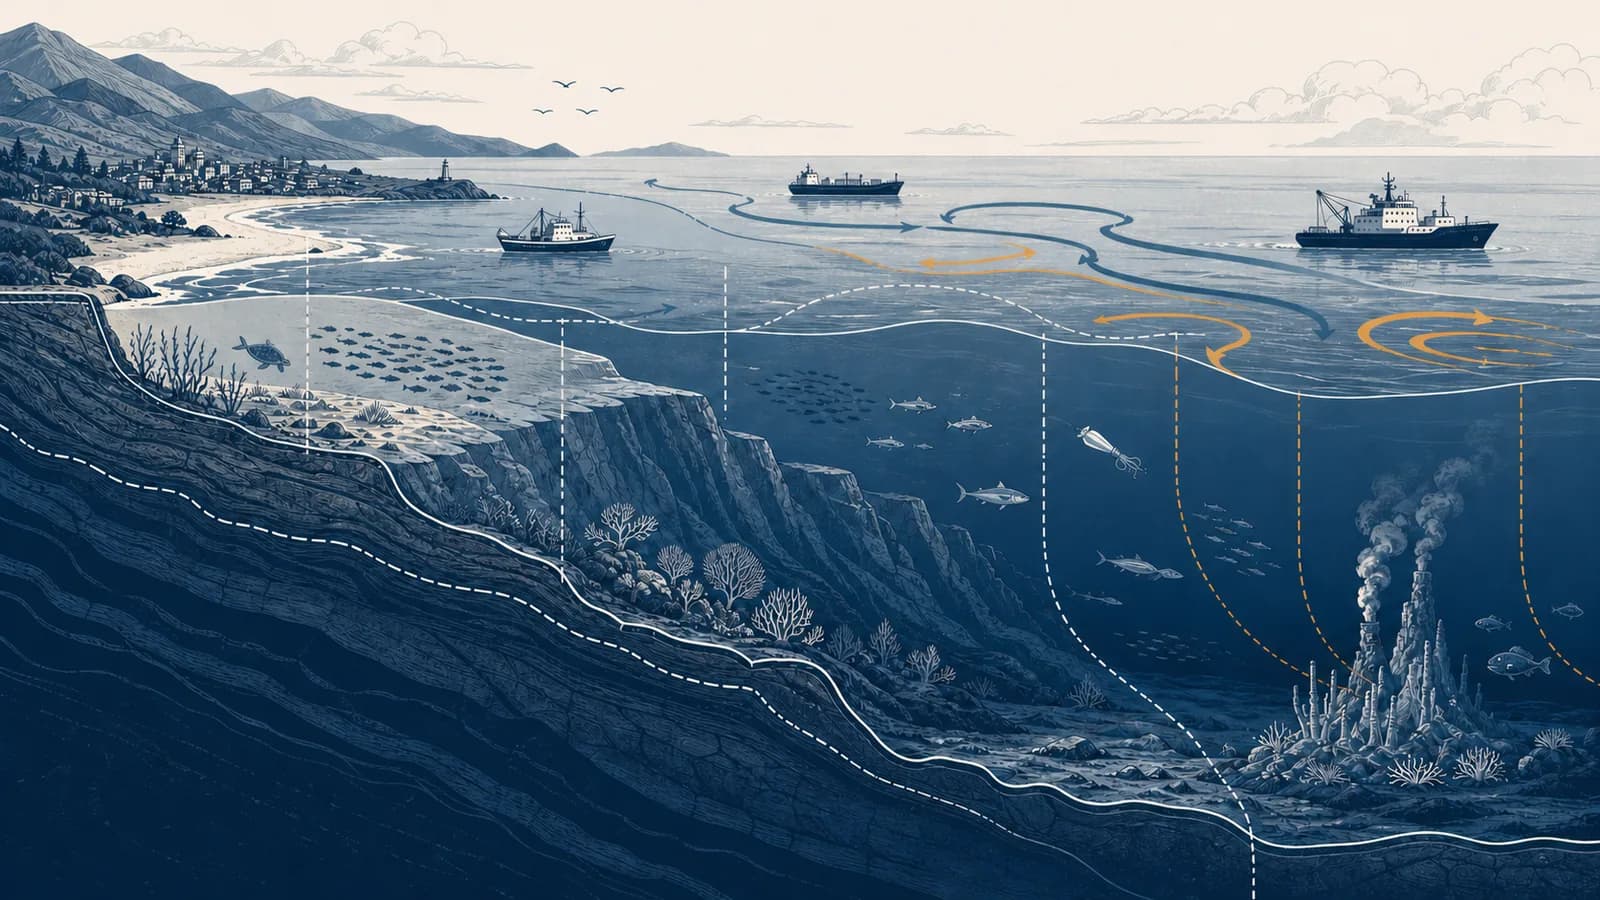
Marine geography is a branch of geography that explains how oceans, coasts, seabeds, living systems, and human activity are arranged and connected, in the context of Earth's marine environment. It answers common questions about ocean geography, coastal processes, marine resources, sea routes, and maritime boundaries. The field exists because water moves heat, materials, organisms, people, and political power across places that maps often make look empty. A fishing ground, a container port, a coral reef, and a submarine cable may occupy the same sea, but each depends on a different set of physical and human connections.
What marine geography actually is
Marine geography studies spatial patterns and relationships in oceans and coastal zones. It joins physical geography, human geography, ecology, economics, and politics to explain where marine features occur, how they change, and how people use or govern them.
The subject starts with location, but it does not stop there. A marine geographer asks why a port developed on one estuary rather than another, why nutrients collect in a particular current, or why two states disagree over the same patch of seabed. Each question links a place to a process.
Five kinds of space repeatedly overlap:
- The water column, which varies with depth, temperature, salt content, oxygen, light, and movement.
- The seabed, including continental shelves, slopes, abyssal plains, ridges, trenches, and sediments.
- The coast, where waves, rivers, rock, sediment, weather, and construction meet.
- Living space, formed by habitats, feeding grounds, breeding sites, and migration routes.
- Human space, made by ports, shipping lanes, fisheries, cables, energy sites, borders, laws, and cultural ties.
The sea is a continuous blue surface separating named areas of land.
The sea is a layered, moving space in which physical conditions, ecosystems, infrastructure, and jurisdictions overlap.
This wider view explains why a boundary drawn at the surface can affect drilling below the seabed, fishing in the water, and cable repair on the bottom. It also shows why the same storm can be a coastal hazard, a shipping delay, and a burst of nutrient mixing.
How the ocean's physical structure works
The ocean is structured by basin shape, depth, heat, salinity, light, and pressure. These conditions change horizontally and vertically, creating distinct water masses, habitats, circulation paths, and limits on where organisms and human equipment can operate.
Ocean basins are not smooth bowls. Most continents continue underwater as relatively shallow continental shelves. Farther offshore, the seabed drops down the continental slope toward deep plains. Mid-ocean ridges form where tectonic plates separate and new crust is made. Trenches form where one plate descends beneath another. These features steer currents, collect sediments, influence habitats, and shape where cables can be laid.
Depth changes the environment. Sunlight weakens as it passes through water, so photosynthesis is concentrated in the illuminated upper layer. Pressure increases by roughly one atmosphere for each 10 metres of seawater depth, in addition to the atmosphere at the surface. At 1,000 metres, an object therefore experiences about 101 atmospheres of total pressure as a useful approximation. Submersibles, sensors, and animal bodies need structures suited to that load.
At 500 metres, the estimate is atmospheres.
The estimate is practical, not exact. Water density and local atmospheric pressure vary. It still reveals a geographic fact: vertical distance in the ocean changes physical conditions far faster than the same vertical distance in air.
How currents connect distant places
Ocean currents move because winds push surface water, Earth's rotation turns moving water, density differences shift deep water, and continents redirect the flow. Together these processes redistribute heat, nutrients, organisms, pollution, and drifting objects between regions.
At the surface, prevailing winds transfer momentum to water. The Coriolis effect deflects motion to the right in the Northern Hemisphere and to the left in the Southern Hemisphere. Continents block and bend the flow, helping create large rotating current systems called gyres.
Deep circulation has another driver. Cold water is generally denser than warm water, and saltier water is generally denser than fresher water. Where surface water becomes dense enough, it sinks and spreads at depth. Mixing and upwelling later return deep water toward the surface. The full system is complex, with several water masses and branching paths rather than one simple conveyor belt.
Solar heating creates temperature contrasts, while winds drag the upper ocean.
The Coriolis effect curves moving water, and basin edges channel it into currents.
Cooling, evaporation, rainfall, river input, freezing, and melting alter temperature or salinity, changing buoyancy.
Moving water carries heat, dissolved substances, plankton, larvae, debris, and chemical signals.
Upwelling shows how physical movement becomes a human geography issue. When winds move surface water away from a coast or across the equator, deeper water can rise to replace it. That water often brings nutrients into sunlit layers, supporting phytoplankton and food webs. Fishing fleets, processing towns, seabirds, and marine mammals may all concentrate around the resulting productivity.
Currents connect causes to effects. A change in wind over one area can alter sea temperature, nutrient supply, rainfall patterns, or fish distribution somewhere else.
That same connection helps explain why offshore energy systems matter on land. The movement of oil and gas through sea routes, and the location of offshore wind sites, connect marine geography with how energy resources shape relations between states.
How coasts change shape
Coasts change when waves, tides, currents, rivers, weathering, organisms, and people remove, carry, or deposit material. The visible shoreline is therefore a temporary boundary whose position depends on sediment supply, water level, geology, and time.
Waves transfer energy into the shore. Hydraulic pressure forces water and air into cracks. Rock fragments carried by waves strike cliffs and platforms. Dissolved minerals can be removed through chemical processes. The loosened material then becomes sediment that waves and currents sort by size.
Where waves approach at an angle, swash carries sediment diagonally up the beach. Gravity draws the backwash downslope. Repeated movement produces longshore drift, a net transfer of sand or shingle along the coast. A groyne can trap some of this material on its updrift side, but the reduced supply may increase erosion farther along. A structure can protect one frontage while shifting a problem to its neighbour.
A council considers building a seawall in front of homes. The wall may stop the cliff from retreating locally, but reflected wave energy can scour the beach. Engineers and planners must examine sediment movement, maintenance costs, access, habitats, and the effect on nearby shores before choosing a design.
Depositional coasts depend on incoming material. Rivers bring sediment from drainage basins. Cliffs provide eroded particles. Shells and coral fragments add biological material in some environments. Dunes form when wind carries dry beach sand inland and vegetation traps it. Salt marshes and mangroves can slow water and capture fine sediment, though their success depends on enough space and a suitable rate of change.
Coastal management is therefore a geographic allocation problem. It decides which land, buildings, habitats, and access routes receive protection, and who bears the cost or added risk. Similar choices appear wherever dense development reaches a changing shoreline.
Marine ecosystems versus simple habitat maps
A habitat map marks where environmental conditions suit a community, while an ecosystem explanation shows the exchanges that keep that community functioning. Marine life depends on moving water, energy, nutrients, reproduction, disturbance, and connections between separate habitats.
A coral reef polygon or seagrass patch is useful, but a line around it can hide dependence on places outside the line. Fish may feed on one habitat and shelter in another. Larvae may drift far before settling. Rivers may deliver nutrients, sediment, fresh water, or pollution. Offshore currents may carry heat and oxygen through the system.
A species occurs inside the coloured area and is absent outside it.
The species uses feeding, breeding, nursery, refuge, and migration areas linked by currents and movement.
Productivity also varies. Phytoplankton need light and nutrients. Open tropical surface waters can receive abundant light but have limited nutrients because warm, buoyant water resists mixing with deeper nutrient-rich water. Upwelling zones can be highly productive because nutrients reach the illuminated surface. Estuaries often receive nutrients and organic matter from land, while tides mix salt water and fresh water.
Food webs turn this primary production into geographic patterns. Plankton support small consumers, which feed larger animals. Temperature fronts and current boundaries can gather prey, attracting predators and fishing vessels. Seasonal breeding and migration cause the same place to carry different ecological importance at different times.
Maps used for conservation therefore need more than permanent boundary lines. They may need seasonal closures, depth limits, buffer zones, migration corridors, and rules for activities outside a protected area. Effective protection follows the mechanism that connects places.
How maritime zones turn distance into authority
Maritime zones are legal areas measured outward from coastal baselines, with different rights and duties attached to each distance. They organize navigation, fishing, seabed resources, enforcement, research, and environmental responsibilities where state interests meet at sea.
Under the United Nations Convention on the Law of the Sea, a coastal state may claim a territorial sea up to 12 nautical miles from its baseline. Its exclusive economic zone, or EEZ, may extend up to 200 nautical miles. One nautical mile equals exactly 1,852 metres, so 200 nautical miles equals 370.4 kilometres.
These zones do not all mean ownership in the same sense. A state has sovereignty over its territorial sea, subject to legal rules such as innocent passage. In its EEZ, it has sovereign rights for exploring, exploiting, conserving, and managing natural resources, plus specified jurisdiction, but other states retain freedoms that include navigation and overflight under the convention.
Measurement becomes difficult where coasts face each other, islands sit offshore, or shorelines are deeply indented. Two 200 nautical mile claims can overlap. States then negotiate, use courts or tribunals, or leave a disagreement unresolved. The argument may concern fish, oil, gas, security, historical use, or the meaning of a coastal feature.
This is a maximum distance from the relevant baseline, not a guarantee of a full circle around every coast.
Boundary disputes show the connection to how competition over valuable resources becomes conflict. Geography supplies the coastlines, distances, deposits, habitats, and routes. Law supplies rules for turning those facts into claims.
How marine geography shows up in shipping, communications, food, and work
Marine industries connect environmental conditions at sea with routes, infrastructure, labour, and markets on land. Shipping, communications, fishing, and aquaculture all depend on depth, weather, currents, ecosystems, legal controls, port access, technology, and the cost of delay.
Shipping and cables depend on routes through physical space
A route drawn as the shortest line on a world map may not be the practical route. Map projections distort distance, land blocks direct passage, shallow water limits vessel draught, and canals or straits concentrate traffic. Seasonal storms, sea ice, piracy risk, port queues, and canal restrictions can change the choice.
Ports link marine and land networks. A sheltered deep-water site is helpful, but it is not enough. A successful port also needs channels, cranes, storage, customs systems, workers, road or rail connections, and access to markets. Dredging may maintain channel depth, but moved sediment must go somewhere and can affect habitats or water quality.
A manufacturer needs parts shipped between two continents. The team compares sailing time, canal access, vessel size, seasonal hazards, port handling, rail connections, and the cost of delay. Marine geography turns the blue section of the route into a set of measurable constraints.
Submarine communications cables occupy a different network. Surveyors map seabed slopes, sediment, earthquake zones, fishing activity, anchor risk, and landing sites. Cables generally need routes that avoid unstable ground and allow repair vessels to reach faults. Near shore, burial can protect them from anchors and fishing gear. In deep water, remoteness can reduce human contact, but repair remains technically demanding.
Chokepoints reveal network dependence. A narrow strait or canal joins larger sea areas, so disruption in a small place can redirect vessels over much greater distances. The geographic significance of the passage comes from the network flowing through it, not simply its area on a map.
Fishing and aquaculture connect ecosystems to markets
Marine geography shapes food and employment by determining where species live, when they move, which fleets can reach them, where catches can land, and which rules apply. A fishery is a linked system of ecology, labour, technology, markets, and government.
Fish do not distribute themselves according to administrative boundaries. They respond to temperature, oxygen, prey, salinity, habitat, breeding cycles, and currents. A stock may cross several EEZs and the high seas. If each fleet treats the fish it encounters as an isolated local supply, total pressure can exceed the stock's ability to reproduce.
Managers use tools such as catch limits, size limits, gear rules, closed seasons, protected nursery grounds, and monitoring. Each tool answers a spatial or temporal question. A closed area works only if it protects the place used at the relevant life stage. A seasonal rule works only if its dates match migration or breeding closely enough.
Work continues after a vessel returns. Catch may pass through auctions, cold storage, processing plants, wholesalers, shops, and restaurants. A disruption at a harbour or a change in species location can affect incomes inland. Small boats and industrial vessels also face very different fuel costs, storage capacity, safety equipment, and political influence.
Aquaculture depends on geography too. A farm site needs suitable temperature, salinity, water exchange, depth, shelter, access, and waste dispersal. It may compete with navigation, recreation, fishing, conservation, or views. Poor placement can expose stock to storms, disease exchange, low oxygen, or pollution. Good placement cannot remove every risk, but it aligns production with local conditions.
These links connect marine production with how societies secure reliable access to food. Supply depends on more than the quantity in the water. Access, price, storage, nutrition, working conditions, and distribution decide who benefits.
How maps and measurements reveal a moving ocean
Marine maps combine observations collected at different depths, times, and scales to represent a changing environment. Satellites, ships, buoys, floats, sonar, tide gauges, samples, and local knowledge each measure particular features and carry particular limits.
Satellites can repeatedly observe wide areas. Instruments infer sea surface temperature from emitted radiation, estimate surface height using radar altimetry, and detect ocean colour associated with substances such as chlorophyll. They do not directly see every condition at depth, and clouds interfere with some sensors.
Ships collect detailed profiles and physical samples, but a cruise covers a limited route during a limited period. Autonomous floats can repeatedly sink, drift, and rise while measuring properties such as temperature and salinity. Moored buoys provide time series at fixed locations. Sonar uses sound travel to map depth or locate objects because sound moves effectively through water.
| Method | Best at showing | Main limitation |
|---|---|---|
| Satellite sensor | Repeated, broad surface patterns | Limited direct information below the surface |
| Research ship | Detailed profiles and physical samples | Expensive, with restricted coverage in space and time |
| Autonomous float | Repeated measurements through depth | Drifts with currents and does not sample every coast |
| Moored instrument | Long records at one location | Cannot represent the whole region by itself |
| Sonar survey | Seabed depth, shape, or targets | Coverage depends on survey tracks and instrument resolution |
Every marine map is therefore a model built from selected measurements. Interpolation fills gaps between observations. A colour scale groups continuous values. A projection changes shape, distance, or area. A time average can reveal a normal pattern while hiding short events. A good reader checks the map's date, depth, scale, units, source, and uncertainty before drawing a conclusion.
A surface map is not an ocean map at every depth. Two water masses can occupy the same latitude and longitude while moving in different directions at different depths.
Local knowledge can add observations that instruments miss, including seasonal currents, safe passages, spawning places, or shoreline change. It should be recorded with its source and context, then considered alongside measurements rather than treated as either automatically superior or automatically unreliable.
What causes ocean dead zones?
Ocean dead zones are areas where dissolved oxygen falls so low that many animals cannot remain. They form when nutrient enrichment drives high biological production, decomposition consumes oxygen, and weak mixing prevents enough oxygenated water from replacing it.
Fertilizer, sewage, and other nutrient sources can enter rivers and coastal waters. Algae and plankton grow, then die or are eaten. Microorganisms decomposing organic matter use dissolved oxygen. If warm, fresher surface water sits above colder, saltier bottom water, the density difference can reduce vertical mixing. Bottom oxygen then declines.
The word dead is a shorthand. Conditions vary by place, depth, season, species, and oxygen concentration. Mobile animals may leave if an escape route exists. Less mobile organisms can be stressed or killed. Reducing nutrient inputs addresses a major cause, while weather and circulation affect how quickly a particular low-oxygen event develops or clears.
How deep is the ocean, and why do depth numbers differ?
Ocean depth is the vertical distance between the sea surface and seabed at a stated location and time. Reported values differ because the seabed is uneven, sea level moves, instruments have uncertainties, and summaries may mean average, local, or maximum depth.
Echo sounding estimates depth by sending a sound pulse downward and measuring its return. The basic calculation uses half the round-trip travel time because the pulse travels to the bottom and back.
If sound travels at an assumed and returns after 4 seconds, .
The worked value uses an approximate sound speed. Actual sound speed varies with temperature, salinity, and pressure, so surveys apply corrections. Tides and vessel motion also matter. A published depth without a position, method, and reference level is less informative than it first appears.
3 mistakes people make with marine geography
The most common errors are treating the ocean as flat, treating boundaries as physical barriers, and treating one observation as permanent. Each mistake removes movement or scale, which are the features that explain most marine patterns.
1. Treating the sea as a two-dimensional surface
A latitude and longitude identify a horizontal position, but depth can change temperature, pressure, oxygen, light, species, and current direction. Add a depth or depth range whenever a claim concerns conditions below the surface.
2. Assuming a legal line stops natural movement
Fish, pollution, heat, storms, and currents cross jurisdictional boundaries. A map of EEZs explains authority, not the edge of an ecosystem. Compare legal maps with current, habitat, watershed, and migration maps before deciding which governments or communities are connected to an issue.
3. Reading a snapshot as a permanent pattern
A satellite image may capture a bloom, front, plume, or warm patch that shifts within days. Seasonal cycles and rare events can produce different maps of the same area. Check the observation date and seek a time series before calling a feature typical.
The takeaway: Read every marine claim through four questions: where is it, at what depth, at what time, and by which process is it connected to other places?
Marine geography makes the blue parts of the map readable
Marine geography shows that oceans are structured, inhabited, measured, worked, and governed places. Reading them well means linking physical processes to ecosystems and human decisions, then testing every pattern against depth, movement, scale, and time.
The subject belongs within the wider study of places, environments, and spatial relationships because it asks the same basic geographic questions on water: what is where, why is it there, how is it connected, and who is affected?
Next time you see a shipping forecast, seafood label, beach defence, cable outage, coastal flood map, or dispute over offshore resources, locate the hidden geography. Look for the moving water, the shape beneath it, the living network, the route to land, and the line of authority. Those layers turn an expanse of blue into an explainable place.