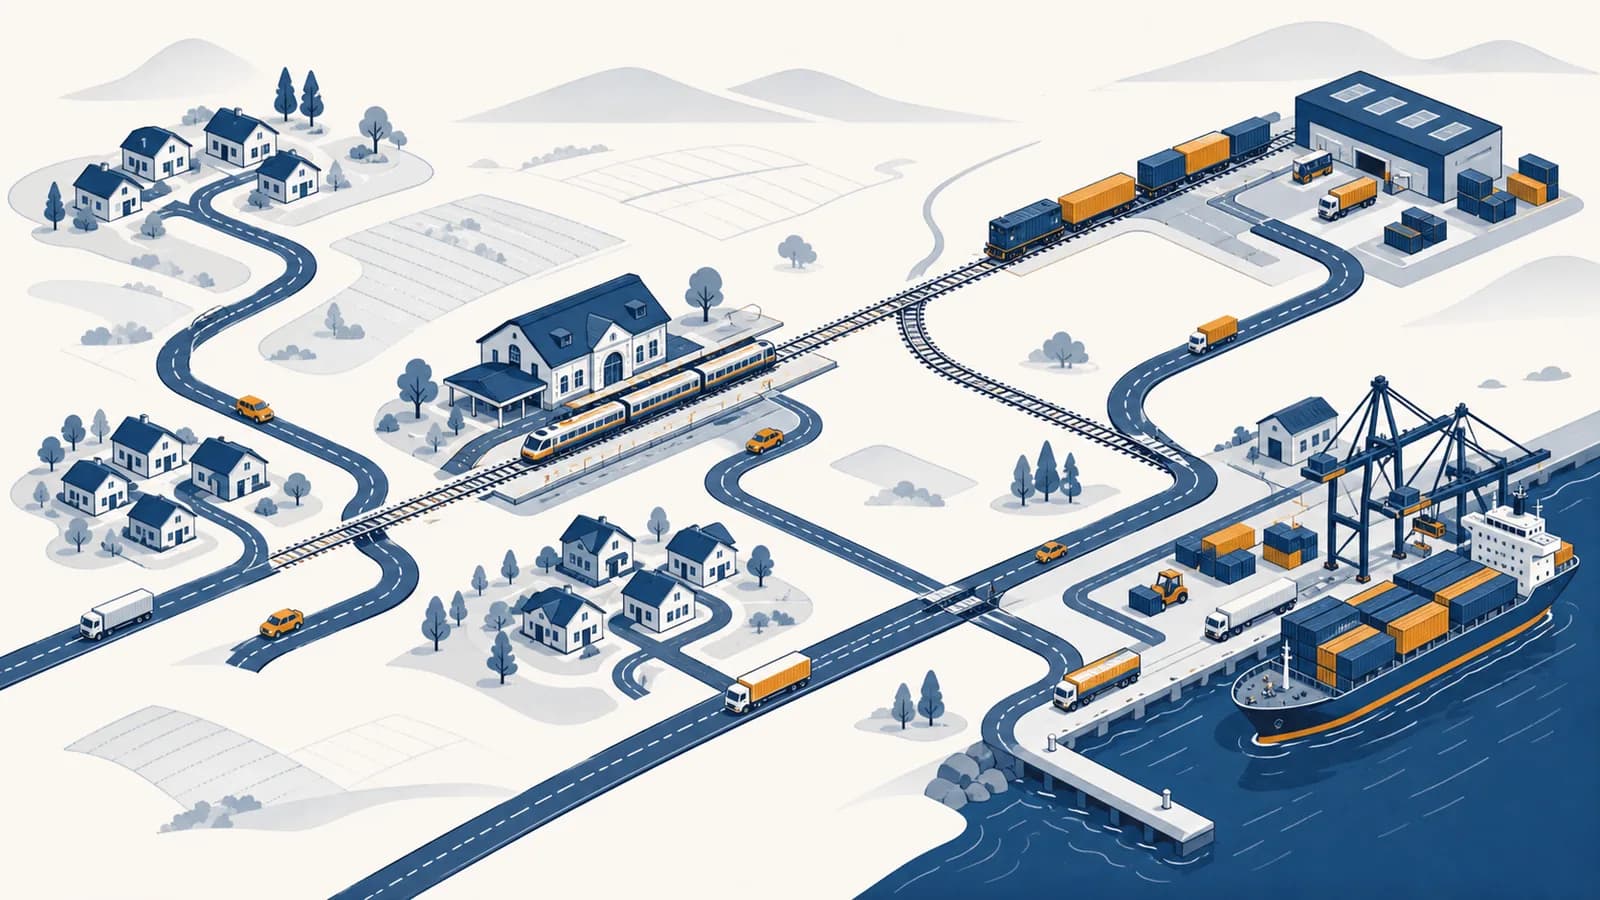
A transportation network is a system that connects places and moves people, goods, and information along routes, in the context of human geography. A transportation network definition therefore includes the routes, nodes, transport modes, and flows that make movement possible. Transport geography studies how roads, railways, shipping lanes, air corridors, pipelines, and walking paths organize space. These networks exist because homes, jobs, resources, markets, and services are in different places. Their design changes travel time, transport cost, access, trade, land use, and the choices people can realistically make.
What the parts of a transportation network actually are?
A transportation network is made of nodes where movement starts, ends, or changes; links that join those nodes; modes that carry traffic; and flows moving through the system. Rules, schedules, prices, and physical capacity determine which possible movements actually occur.
A road map shows the simplest version. Intersections, towns, warehouses, ports, and stations are nodes. Road segments, rail tracks, ferry crossings, flight paths, and canals are links. Cars, buses, bicycles, trains, ships, and aircraft are modes. The passengers, vehicles, parcels, containers, or tonnes of grain moving during a period are flows.
The parts have different jobs. A neighborhood bus stop is a node, but it has little value without a route serving it. A motorway is a high capacity link, but it cannot deliver a parcel to a front door without local streets. A port is a transfer node because cargo changes between ship, rail, road, or barge there. A network works as a connected system, not as a pile of isolated infrastructure.
Terminals are nodes designed for loading, unloading, or transferring. Hubs are nodes through which many routes or flows are concentrated. Every hub is a node, but most nodes are not hubs. A small station may serve only its immediate area, while a central station connects many lines and lets passengers transfer between them.
A line on a map is not automatically a usable connection. Direction rules, border controls, fares, timetables, weight limits, private ownership, and opening hours can all prevent movement along a physically continuous route.
Geographers also define networks at different scales. A school walking network includes gates, paths, crossings, and nearby streets. A national rail network joins cities and industrial areas. A global maritime network links ports through shipping lanes and canals. The scale changes, but the same node, link, mode, and flow model still applies.
How do routes, nodes, modes, and flows work together?
Movement works as a chain: a traveler or shipment enters at an origin, follows one or more links, may transfer at nodes, and leaves at a destination. Each stage adds time, cost, and possible delay, so the whole trip depends on every stage.
A person needs to reach work, or a shop needs stock. The origin and destination define the basic transport problem.
The traveler or carrier compares available paths using time, price, reliability, comfort, safety, and rules such as vehicle restrictions.
The movement occupies road space, a seat, a cargo slot, or terminal equipment. Other flows may be using the same limited capacity.
A transfer may join a local bus to a train, or a truck to a ship. Waiting and handling become part of the total trip.
The trip is complete only when the person or shipment reaches the place that creates value, not when the longest transport leg ends.
Imagine a student traveling ten kilometers to college. The train covers eight kilometers quickly, but the student first walks to the station, waits, rides, transfers, and walks again. If the service runs only once an hour, missing it may matter more than the train's speed. This is why transport analysts measure a door to door trip, including access and waiting, rather than looking only at motion inside a vehicle.
Modes differ because they combine speed, carrying capacity, route flexibility, energy use, and terminal needs in different ways. A ship can carry large loads between suitable ports, but it cannot reach an inland shop. A truck carries less but can use many streets and serve the final destination. Rail works well where enough traffic can be gathered along fixed corridors. Walking needs little infrastructure, but practical trip length is limited by time, terrain, weather, and personal ability.
Transfers allow those strengths to be combined, yet each transfer creates friction. People must find the next platform and may need another ticket. Cargo may require cranes, storage, inspections, and paperwork. Standardized containers reduce handling because the same sealed box can move between ship, train, and truck without unloading every item inside.
How does network shape control access and efficiency?
Network shape controls how directly places are connected, how many alternatives exist, and which nodes attract the most traffic. A dense grid offers many route choices, while a branching or hub based network concentrates movement and can serve wide areas with fewer links.
A grid has many intersections and several possible paths between nearby places. It can distribute traffic and allow detours, although frequent crossings may slow through movement. A radial network sends routes toward a center, which helps people reach a central business district but makes trips between outer areas indirect. A linear network follows a coast, valley, river, or narrow settlement corridor. A hub and spoke network connects many smaller nodes through one or a few hubs.
Separate links connect many origin and destination pairs. Trips can be short, but operating every link may require substantial demand and resources.
Flows are gathered at a hub before being redistributed. Fewer links can connect many places, but transfers and hub disruption affect more trips.
The arithmetic explains the attraction of hubs. If four towns each need a direct link to every other town, six links are required: AB, AC, AD, BC, BD, and CD. Connect all four towns to one separate hub instead, and only four spoke links are needed. The saving becomes larger as more towns join, though trips between towns now pass through the hub.
Shape also produces centrality, a family of measures for a node's position in the network. A node has high degree centrality if many links meet there. It has high betweenness centrality if many shortest paths pass through it. Those are different properties. A local street junction can have several connecting roads, while a bridge with only two ends can have high betweenness because it carries the only practical route across a river.
Physical geography often explains the pattern. Mountains channel roads and railways through passes. Rivers create barriers until bridges or tunnels connect their banks. Flat land may permit a grid, while islands depend on ports and airports. Human decisions then reinforce the pattern as firms, homes, and services locate near existing access. This feedback helps explain how settlements expand around transport infrastructure.
How is network distance different from straight line distance?
Straight line distance measures the shortest geometric separation between two places, while network distance follows usable links. Travel time and generalized cost go further by including speed, waiting, fares, transfers, reliability, comfort, and other burdens that affect a real decision.
Two houses may be 300 meters apart across a railway, yet the nearest legal crossing may require a two kilometer walk. The straight line distance is small, but the network distance is much larger. A fast road can reverse the pattern: a farther hospital beside a motorway may take less time to reach than a nearer hospital connected by slow streets.
If a route is 12 km while the straight line distance is 8 km, its circuity is .
Circuity compares route directness, but it does not decide which route is best. A 12 kilometer motorway route may take less time than an 8 kilometer route through crowded streets. It may also cost more in tolls or fuel. Analysts therefore use generalized cost, which puts several burdens into a common decision measure. The exact weights depend on the traveler or carrier. A commuter may value reliable arrival time; a carrier moving fresh food may place a high cost on delay; a walker may avoid a route that feels unsafe after dark.
Route A takes 25 minutes and has no fare. Route B takes 15 minutes and costs $4. A traveler who values ten minutes saved above $4 chooses B. Another traveler with more time than money chooses A. The same network produces different choices because cost includes more than distance.
Accessibility is the result that matters. It asks which useful destinations can be reached, by whom, within a given time or cost. Adding a nearby station can expand access, but only if people can reach its entrance and use its service. The location of homes affects demand, a relationship examined more closely through the spatial pattern and concentration of populations.
How is transportation network performance measured?
Network performance is measured by how much access and movement the system provides, at what time, cost, reliability, safety, and environmental burden. No single measure is sufficient because a fast route can still be unreliable, inaccessible, expensive, or poorly connected.
Connectivity records whether nodes are joined and how many alternative paths exist. Capacity is the maximum flow a link or terminal can handle under stated conditions. Throughput is the flow actually handled during a period. Travel time measures trip duration, while reliability measures how consistent that duration is. Accessibility measures reachable opportunities rather than movement alone.
Suppose a bridge can process 1,200 vehicles in an hour under the conditions assumed in a simple exercise, and 900 vehicles cross during one hour. Its observed volume to capacity ratio is 0.75. The arithmetic is visible, but the interpretation needs care. Capacity is not a permanent physical constant. Lane width, junction timing, vehicle mix, weather, incidents, and driving behavior can change it.
In the exercise, , so observed flow uses three quarters of the stated hourly capacity.
Averages can hide the experience people care about. If a bus trip takes 30 minutes on most days and 70 minutes on some days, an average alone does not tell a passenger how much spare time to allow. Freight operators face the same problem because uncertain arrival can leave workers and machinery waiting. Reliability often changes decisions even when average travel time stays the same.
Accessibility can be calculated with a simple threshold. Count the jobs, schools, clinics, or shops reachable within 30 minutes by a stated mode at a stated time. The conditions must be explicit. A map based on driving at midnight cannot describe access for a person who uses a wheelchair and travels by bus at 8 a.m. Good measurement states whose movement is being measured.
How do transportation networks show up in city life?
In cities, transportation networks shape where people can live, work, study, shop, and receive care within a limited daily time budget. Streets, footpaths, transit lines, stations, parking, and service schedules combine to create unequal patterns of access.
A city street performs several functions at once. It is a movement link for buses, cars, bicycles, and pedestrians. It is also a place for deliveries, trees, drainage, utility lines, social activity, and building entrances. Giving more width or signal time to one use leaves less for another. Transport planning is therefore a geographic allocation problem as well as an engineering problem.
Consider two districts the same distance from the city center. One has frequent buses on connected streets, safe crossings, and shops near stops. The other has infrequent service, disconnected cul de sacs, and a motorway that pedestrians cannot cross. Their straight line location looks similar, but their residents do not have equal access. This difference influences rent, job options, business locations, and the amount of time families spend traveling.
A station is not the same as access. A station behind a six lane road, without a safe crossing or step free entrance, can be close on a map and difficult to use in practice.
Networks and land use change each other. A busy station can attract offices, shops, and housing because many people can reach it. New development then generates more trips and may justify more frequent service. A motorway interchange may attract warehouses that need truck access. These choices can spread destinations farther apart, making some trips harder without a vehicle.
Equity questions begin with differences between people, not just places. A route that works for a nine to five commuter may fail a hospital worker finishing after midnight. Stairs affect a wheelchair user, a parent with a stroller, and a traveler carrying luggage. Fare structures affect households differently. Analysts use maps and travel data to identify these gaps, but local observation often reveals barriers that a route line does not show.
Transport also changes culture by shaping who meets whom and which places feel near. Movement can affect social contact, access to cultural institutions, and the everyday boundaries people experience between neighborhoods.
How do transportation networks show up in freight and trade?
Freight networks connect extraction sites, farms, factories, warehouses, ports, shops, and customers through linked transport and storage stages. Firms choose routes and modes by balancing shipment size, speed, value, reliability, handling needs, and the risk of disruption.
A product usually travels through more than one network. Coffee might move by local road from farms to a processing site, by truck or rail to a port, by ship to another country, then by rail, truck, or van to a warehouse and shop. Information moves alongside it: orders, customs documents, tracking updates, and payment records coordinate the physical flow.
Consolidation makes large scale transport possible. Many small shipments are gathered into a larger load for the long distance segment, then separated near their destinations. This improves vehicle use but adds sorting, storage, and schedule coordination. A late feeder truck can miss a train or sailing, so the consequence of delay depends on the next connection.
Different goods create different network needs. Fresh produce needs controlled temperature and timely delivery. Fuel may move by pipeline where a steady flow justifies fixed infrastructure. Heavy bulk materials often favor water or rail where available. High value replacement parts may travel by air because the cost of a stopped factory can exceed the extra transport price. Geography helps explain these location and mode choices through the spatial organization of production, trade, and employment.
Trade corridors develop where infrastructure, demand, and institutions line up. A deep water port alone does not create an effective corridor. It also needs inland connections, terminal capacity, labor, storage, information systems, and rules that let cargo pass. A slow inspection process or a missing bridge can limit the whole chain even if every other segment has spare capacity.
This principle explains why firms keep some inventory near customers or use more than one supplier. Storage can absorb timing differences, but it costs money and space. A highly efficient chain with little spare time may be inexpensive during normal operation and vulnerable when one connection fails. The design choice is a tradeoff between routine efficiency and tolerance for variation.
What congestion actually is?
Congestion is the loss of speed or throughput that occurs when demand approaches or exceeds the usable capacity of a link, junction, terminal, or service. It forms at constrained points, then queues can spread backward and interfere with other parts of the network.
A bottleneck controls flow because its capacity is lower than the demand arriving there. On a road, it may be a merge, signal, bridge, or incident. On a railway, it may be a single track segment or a busy platform. At a port, it may be a crane, gate, storage yard, or inspection desk. Increasing capacity somewhere else does not remove that constraint.
The whole route is slow, so every segment needs to be widened or accelerated.
Find where flow is constrained, why a queue forms there, and whether changing that point would shift the queue elsewhere.
Queues are a storage problem as well as a delay problem. Vehicles waiting at one junction occupy space on an upstream road. If the queue reaches the previous junction, it can block movements that do not use the original bottleneck. The visible traffic jam may therefore extend far from its cause.
Demand changes with time and behavior. School and work schedules concentrate trips. A crash temporarily reduces capacity. Navigation advice can redirect drivers onto another route. New capacity may make a trip more attractive, changing route, destination, mode, or travel time choices. Forecasting congestion therefore requires assumptions about how people respond, not only a count of lanes.
How does network resilience work?
Network resilience is the ability to keep providing useful connections during disruption and to restore service afterward. It depends on alternative routes, spare capacity, repair resources, clear operating plans, and the ability to adapt service to the people and goods most affected.
Redundancy means that another usable path or facility can perform a similar job. Spare capacity means the alternative can accept additional flow. They are not identical. A second bridge offers redundancy, but it may provide little practical backup if it is already full, has a low weight limit, or leads to the same flood prone approach road.
A river crossing closes after an inspection. Cars can use a smaller bridge upstream, buses can be rerouted, but heavy trucks must travel to a distant crossing. The disruption map differs by mode because each alternative has different rules and capacity.
Resilience planning starts by identifying critical nodes and links, then testing plausible failures. Which communities lose their only road? Which hospital staff cannot reach a shift? Which freight flows have no suitable detour? The answers reveal single points of failure, places where one loss disconnects the network or removes an essential service.
Recovery is also geographic. Repair crews, replacement parts, fuel, and information must reach the damaged place. Restoring the busiest link first may move the most traffic, while restoring a smaller link may reconnect an isolated settlement. The choice depends on the objective and on who bears the delay.
4 mistakes people make with transportation networks
Four common mistakes are treating infrastructure as access, confusing speed with a good trip, judging a network only by average conditions, and assuming a new link has one fixed effect. Each mistake ignores interactions among people, routes, schedules, costs, and land use.
1. Treating a nearby route as usable access
Distance to infrastructure is only one part of access. A household beside a railway has no rail access if trains do not stop nearby. A bus stop offers little access after the last service. Analysts must check entrances, schedules, fares, direction, physical barriers, and the destinations served.
2. Treating higher vehicle speed as a complete success
Speed on one link can save time, but the complete trip includes walking, waiting, transfers, parking, and delay. A project that accelerates through traffic may make crossing harder for local residents. The correct measure follows actual origin to destination trips and identifies who gains or loses access.
3. Using an average as if every trip were average
Average travel time can conceal peak crowding, rare severe delays, and differences between districts. Averages also conceal differences among travelers. Reporting a typical commute does not show the experience of a night worker or someone making a chain of school, care, and shopping trips.
4. Assuming behavior stays fixed after the network changes
People and firms respond to new links, fares, and schedules. They may change routes, modes, departure times, destinations, home locations, or warehouse sites. Those responses can spread benefits, create new congestion, or alter land use. A forecast should state which behaviors can change and which are held fixed.
The takeaway: Read every transportation map as a set of possible movements, then test which movements are actually usable, for whom, at what time, at what cost, and under what disruption.
Transportation networks turn location into opportunity
Transportation networks make relative location practical: they determine which places function as near, distant, central, isolated, connected, or dependent. Studying them links physical terrain with settlement, economic activity, political choices, environmental effects, and unequal access across human geography.
A place does not become well connected because many lines appear near it on a map. It becomes well connected when people and goods can use those lines to reach valued destinations within acceptable limits. The network also changes those destinations over time, since homes, services, and businesses respond to access.
To examine a network around you, choose one ordinary trip and draw its origin, destination, links, transfers, waits, costs, and barriers. Then remove one link or change the departure time. Notice which alternatives remain and who could use them. This small exercise exposes the structure that a simple route map hides.
You can place that observation beside the wider study of places, people, environments, and spatial relationships. Transportation networks show a central geographic idea in action: distance is measured in kilometers, but its human meaning is produced by connections.