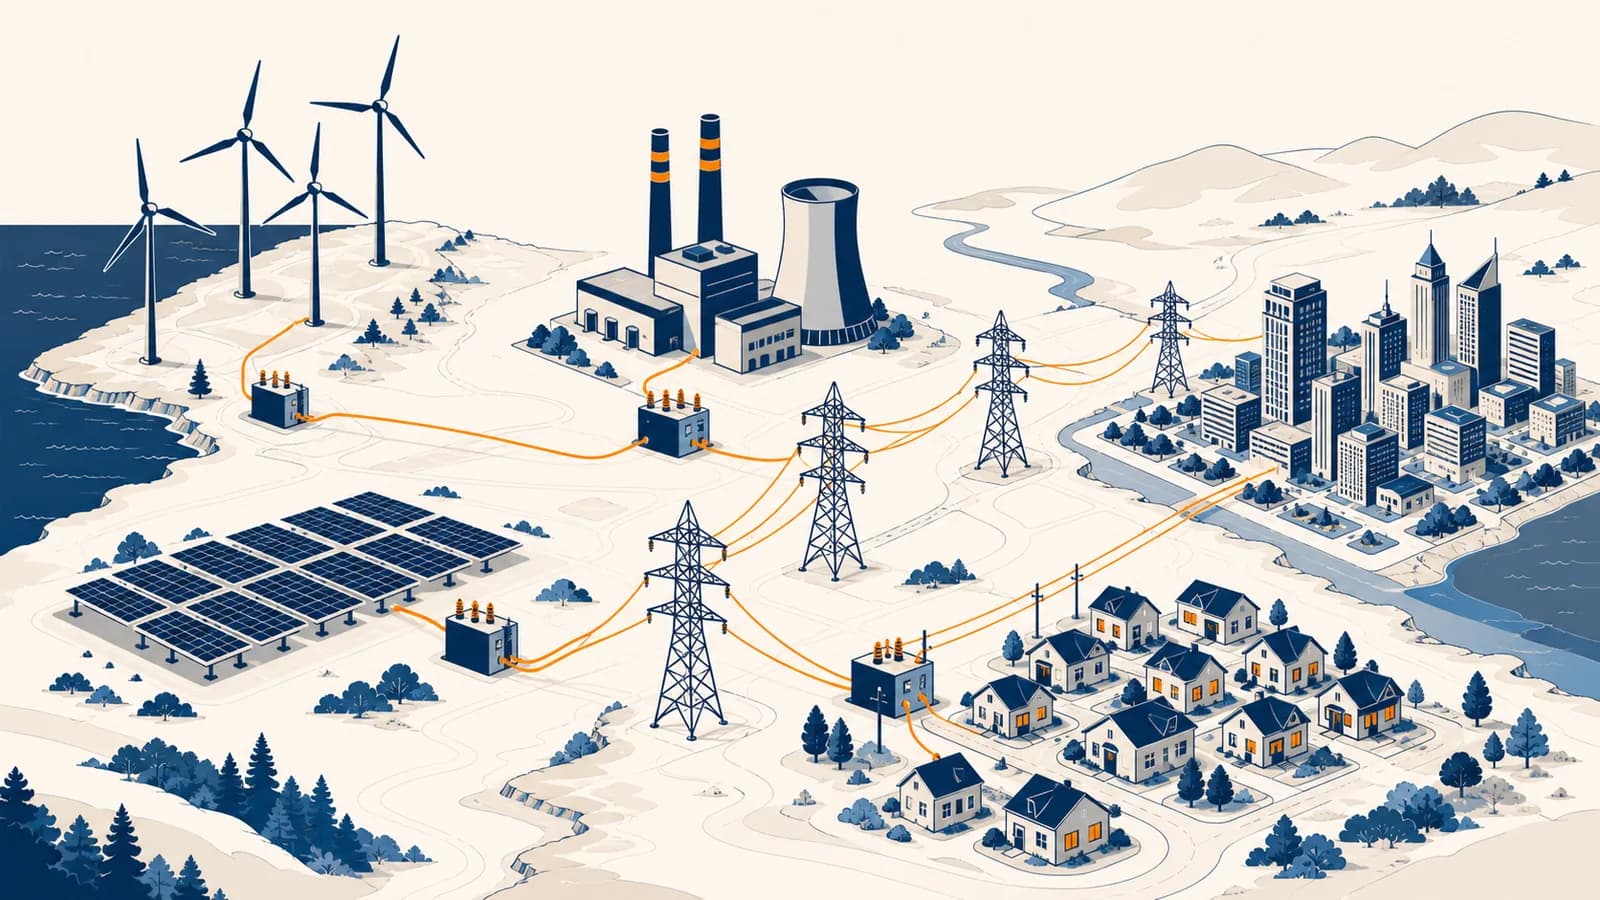
Energy geography is a branch of human and environmental geography that explains where energy resources, infrastructure, demand, and environmental effects are located, in the context of societies and economies. It studies the geography of energy production, energy consumption, electricity grids, fossil fuels, renewable energy, energy security, and the energy transition. The subject exists because energy is never produced or used in an abstract space: every mine, wind farm, power line, fuel bill, and polluted neighbourhood has a location. Those locations shape who receives reliable energy, who earns from it, who carries its costs, and which changes are physically possible.
What energy geography actually is
Energy geography is the study of energy as a spatial system: where sources occur, how energy moves, where people use it, and how benefits and costs are distributed. It connects physical conditions such as geology and climate with infrastructure, markets, government, and daily life.
A map of coal seams is part of energy geography, but it is only a beginning. A useful analysis also maps railways that carry the coal, power stations that burn it, transmission lines that distribute electricity, industries that buy the power, and communities exposed to air pollution or mine closure. Energy geography asks how those features became connected and how the connection might change.
Four ideas organise the subject:
- Location: resources and demand are unevenly distributed. Oil forms in particular sedimentary basins, strong winds follow particular coasts and ridges, and large cities concentrate consumers.
- Flow: energy moves through pipelines, cables, shipping routes, roads, and trade contracts. Each route has a capacity, a cost, and possible points of failure.
- Scale: a household cooker, a city grid, and an international gas market belong to the same system, but decisions at each scale involve different actors.
- Power: ownership and law decide who may build infrastructure, set prices, receive compensation, and refuse a project.
Energy is spatial before it is statistical. A national total can hide the distance between source and user, local shortages, congested power lines, and communities carrying environmental damage.
This perspective fits within the wider set of geography guides because geography examines relations among environments, places, movement, and human decisions. Energy makes those relations visible in pipes, roads, ports, meters, and changing land use.
How an energy system works across space
An energy system works by converting a source into useful energy, moving it through infrastructure, and matching supply with demand at particular places and times. Geography affects every stage because sources, networks, users, storage sites, and environmental impacts rarely occupy the same location.
Consider a gas heated home. A well extracts natural gas from a reservoir. A processing plant removes water and unwanted compounds. High pressure pipelines carry the gas across a region, local pipes lower the pressure and distribute it, and a boiler converts chemical energy into heat. The useful service is a warm room, not the gas itself. At every stage, some energy is used or lost, land is occupied, equipment has a capacity limit, and an organisation controls access.
Identify a stock such as coal or uranium, or a flow such as sunlight, wind, or moving water. Record its quality, timing, and accessibility, not only its presence.
Follow the energy through a refinery, turbine, generator, battery, engine, or boiler. Each conversion changes its form and produces losses, waste heat, or by-products.
Mark ports, pipelines, substations, roads, cables, storage facilities, and border crossings. A source has little practical value if no usable route connects it to demand.
Compare when and where energy is available with when and where users need it. Storage, backup supply, flexible demand, and larger networks can correct a mismatch.
Identify emissions, water use, habitat change, noise, waste, jobs, tax income, household costs, and exposure to failure. Different places may receive different parts of this balance.
This chain is why an apparently simple statement such as “the region uses solar energy” needs unpacking. Panels may generate electricity locally, be manufactured abroad with minerals refined elsewhere, connect through a distant substation, and supply demand hours after noon through a battery. The system has several geographies at once.
Primary energy versus energy carriers
Primary energy exists in nature before human conversion, while an energy carrier is a form made to deliver energy to users. Crude oil, sunlight, wind, and uranium are primary sources; electricity, hydrogen, petrol, and district heat carry converted energy through an economy.
A natural stock or flow enters the human energy system. Its geography follows geology, climate, relief, rivers, or biological production. Examples include coal underground and sunlight reaching a roof.
A produced form moves energy between source and service. Its geography follows factories and networks. Electricity travels in wires, petrol in tanks and trucks, and hydrogen in containers or pipes.
The distinction prevents double counting and bad comparisons. Electricity is not mined. It must be generated from another energy source, then delivered almost immediately or placed in storage. Hydrogen is similar: using it produces no carbon dioxide at the point of use, but making it requires energy. Its overall effect depends on the production route and the source of that energy.
Energy also differs from power. Energy is the amount transferred or used. Power is the rate of transfer. A device rated at one kilowatt uses energy twice as quickly as a device rated at half a kilowatt, assuming both run at their rated power.
A 2 kW heater running for 3 hours uses of energy.
By definition, one watt is one joule per second. One kilowatt-hour therefore equals 1,000 joules each second for 3,600 seconds, which is 3,600,000 joules or 3.6 megajoules. Bills usually charge for kilowatt-hours because they measure accumulated energy, not the instant rate shown in kilowatts.
How physical geography shapes energy supply
Physical geography shapes energy supply by controlling where fuel deposits formed, where natural flows are strongest, and where infrastructure can be built safely. Geology, relief, climate, river flow, water availability, and distance each affect output, cost, reliability, and environmental risk.
Fossil fuels have a concentrated geology. Coal occurs in sedimentary rock sequences formed from ancient plant material. Oil and gas require source rock, heat and pressure, migration pathways, and a reservoir sealed by impermeable rock. Finding one favourable condition does not guarantee a workable field. Extraction must also be technically possible, legally permitted, and connected to transport.
Renewable resources are widespread but uneven in quality. Wind turbines gain much more energy from faster winds because the available power rises steeply with wind speed. Solar output changes with latitude, season, cloud, slope, shade, and panel direction. Hydroelectricity needs moving water and a usable height difference, but reservoirs also flood land and alter river ecosystems. Geothermal projects depend on accessible heat and suitable rock or water conditions.
A developer compares two windy locations. A remote ridge has stronger wind, but it needs a new road and a long grid connection. Farmland near a town has weaker wind, but existing roads, a substation, and nearby demand reduce construction costs. The windiest site is not automatically the best energy site.
Land is not an empty surface awaiting equipment. A proposed reservoir may overlap farms, settlements, archaeological sites, fish habitat, and customary land. A solar farm may compete with food production or fit well on degraded land. Decisions require field surveys and consultation because a resource map does not show every existing use or attachment.
Climate change can alter heating demand, cooling demand, river flow, wildfire exposure, storm damage, and the performance of thermal power stations that need cooling water. The page on how a changing climate reshapes places and economies follows those wider physical and social connections.
How electricity grids move power between places
An electricity grid links generators and users through transmission lines, substations, distribution wires, controls, and markets. Operators must keep generation and demand balanced continuously while respecting the capacity of every line, because electricity follows connected physical paths rather than a chosen shipping route.
Generators turn mechanical, chemical, solar, or other energy into electrical energy. Transformers raise voltage for long distance transmission because moving the same power at higher voltage allows lower current, which reduces resistive heating in wires. Other transformers lower voltage near users. Distribution networks then connect streets, buildings, factories, rail systems, and farms.
To transfer 1,000 W, a 100 V line carries 10 A, while a 500 V line carries 2 A. This simplified example shows why higher voltage can reduce current for the same power.
Grid geography creates constraints. A region may produce more electricity over a year than it consumes yet face shortages during a cold, still evening. A wind farm may be ready to generate while a crowded transmission line prevents all of its output reaching cities. Engineers call forced reductions in available generation curtailment. Building another generator does not remove a bottleneck if the connecting network remains too small.
Interconnectors between regions can share spare capacity and smooth local weather differences. They also create dependence. A fault, storm, cyberattack, equipment shortage, or political dispute can affect users far from the original problem. Grid resilience comes from several measures, including maintenance, alternative routes, reserve generation, storage, emergency plans, and the ability to reduce nonessential demand.
A grid map is therefore both a physical map and an institutional one. It shows wires, but it also implies rules about who can connect, who pays for upgrades, which generator runs first, and how the system responds when supply becomes scarce.
How energy geography shows up in prices and politics
Energy geography shapes prices and politics through uneven resources, costly transport routes, infrastructure ownership, border dependence, and local opposition or consent. A country’s energy security depends on the full supply chain, including equipment and fuels, rather than simply having resources inside its territory.
Energy security means having energy services that remain available at an acceptable cost despite disruption. It has several spatial parts. Diversity of suppliers reduces dependence on one route. Storage can bridge a temporary break. Spare network capacity provides alternatives. Domestic production may shorten some chains, although it can still depend on imported machinery, finance, processed minerals, or specialist labour.
Prices transmit events between places. If a pipeline closes, buyers may compete for fuel arriving through another route. If a transmission line becomes congested, electricity can be cheap near generators and expensive near demand, depending on market design. A household experiences the final bill, which may combine fuel costs, network costs, taxes, support payments, and the supplier’s charges.
A new transmission line would connect rural renewable projects to a city. Urban consumers may gain a more varied electricity supply, developers may gain access to customers, and landowners along the route may lose land or views. Planning is difficult because benefits and burdens fall in different places.
Politics decides how that unevenness is handled. Governments can require environmental assessment, hold auctions for generation, cap or subsidise prices, regulate network companies, set building standards, or pay compensation. Communities can negotiate ownership shares, local funds, jobs, habitat protection, and route changes. None of these choices removes trade-offs, but each changes their distribution.
Energy projects also interact with water. Thermal power stations may need cooling, fuel extraction can affect water quality, and hydroelectric reservoirs change river flow. Understanding how limited water constrains people and production helps explain why an energy option suitable in one region may be risky in another.
How energy geography shows up in work and daily decisions
Energy geography appears in jobs and daily decisions whenever someone chooses a site, route, building, vehicle, supplier, or emergency plan. Planners, engineers, traders, installers, drivers, farmers, lawyers, and households all act on the location, timing, reliability, and cost of energy.
A grid planner compares future demand with substations and line capacity. A wind technician works where turbines stand, often far from the offices financing them. A port manager schedules fuel or equipment deliveries around channel depth and storage space. A lawyer checks land rights and permits. An emergency manager identifies hospitals, water pumps, communications equipment, and residents who need backup power.
Households perform smaller versions of the same analysis. Insulation lowers the energy needed to maintain a comfortable temperature. A heat pump’s suitability depends on the building, climate, electricity supply, installation space, and local rules. An electric vehicle depends not only on battery range but also on parking, charger access, trip patterns, grid connections, and electricity prices by time of day.
The cards show arithmetic, not a claim about a typical home. If a household uses 12 kWh during a day and its panels supply 4 kWh at the same times as demand, another 8 kWh must come from the grid or storage. If the panels make 4 kWh while nobody needs it, the home must export, curtail, or store that energy. Annual production alone cannot reveal this timing problem.
In cities, energy demand and temperature can reinforce each other. Dark surfaces and limited vegetation raise local temperatures, while air conditioning increases electricity demand and releases heat outdoors. The explanation of how built surfaces trap heat in cities shows why building design and neighbourhood form belong in energy planning.
3 mistakes people make with energy maps
Three common mistakes are treating resource potential as usable supply, reading national averages as local conditions, and judging a technology only at its point of use. Better analysis traces infrastructure, timing, conversion losses, supply chains, and unequal effects across places.
1. A resource map is treated as a project map
Resource potential is not the same as deliverable energy. A bright solar map or strong wind map shows a physical opportunity. It does not prove that land is available, planning permission will be granted, finance is affordable, roads can carry equipment, or the grid can accept the output.
To test a proposed site, overlay the resource with protected areas, settlements, slope, land ownership, transport, network capacity, seasonal hazards, and demand. Then investigate information that maps miss, including community priorities and legal claims. A smaller resource near existing infrastructure can sometimes deliver more useful energy than a larger remote resource.
2. A national average is treated as everyone’s experience
Averages compress spatial inequality. A country can report high access while isolated settlements receive unreliable service. An average household bill can hide differences in building quality, climate, income, tariffs, heating fuel, and the ability to pay for efficiency improvements.
Choose a scale that matches the question. National data can compare countries. Regional data can reveal industrial clusters or network limits. Neighbourhood data can reveal poorly insulated housing or exposure to pollution. Household evidence can show difficult choices between heating and other needs. Moving between scales is more informative than declaring one scale correct.
3. Zero emissions at the user is treated as zero impact
Point of use describes one location in a longer chain. An electric motor produces no exhaust where it runs, and a solar panel produces no smoke while generating. Their materials, manufacture, construction, maintenance, electricity source, and disposal still occur somewhere.
Count only fuel burned while a car moves or a generator operates. This is useful for local air pollution, but it cannot compare whole supply chains.
Include material extraction, manufacture, transport, operation, maintenance, and end of life. State the boundary and the unit being compared.
Life cycle analysis does not make every technology equivalent. It makes the comparison more honest. Results depend on location, manufacturing process, operating life, capacity factor, recycling, and the energy sources used upstream. A good claim names those conditions.
How storage changes the geography of renewable energy
Energy storage separates the place and time of energy capture from the place and time of use. It can absorb surplus electricity, release it during shortages, support congested networks, and provide backup, but its value depends on location, duration, efficiency, and operating rules.
A battery beside a solar farm can reduce sudden changes and move some output into the evening. A battery beside a crowded city substation may postpone a network upgrade. Pumped storage uses surplus electricity to move water uphill, then releases the water through turbines later. Heat can be stored in insulated tanks, buildings, or other materials. Fuels can provide longer storage, although making and reconverting them adds losses.
Storage does not create energy. If 10 kWh enters a storage device and 8 kWh later returns, the round trip efficiency in this worked example is 80 percent:
The missing 2 kWh becomes heat or is used by supporting equipment in this simplified example.
Duration matters as much as capacity. A device that can supply 4 kW and stores 8 kWh can sustain that output for two hours in an ideal calculation. It cannot cover a week of low wind. Short fluctuations, evening peaks, multi-day weather patterns, and seasonal gaps require different combinations of storage, networks, flexible demand, and generation.
What capacity factor actually is
Capacity factor is the energy a generator produces over a period divided by the energy it could have produced at full rated power throughout that period. It measures utilisation, not efficiency, and reflects weather, maintenance, fuel availability, demand, and network constraints.
Suppose a 2 MW wind turbine operates for 24 hours. Its maximum possible production is . If its meter records 18 MWh, its capacity factor for that day is:
This is a transparent worked example, not a claimed average for wind turbines.
An efficiency calculation asks how much input energy becomes desired output. A capacity factor calculation asks how much a machine generated compared with its maximum over time. A highly efficient solar panel still has a low capacity factor during a cloudy week because sunlight is limited. A thermal plant can also have a low capacity factor if it is held in reserve or if demand is weak.
How energy access works beyond a grid connection
Energy access means being able to obtain energy services that are reliable, affordable, safe, and adequate for actual needs. A wire near a house is only one condition; service also depends on connection cost, supply quality, appliances, fuel availability, income, and institutions.
A clinic needs dependable electricity for lighting, communications, refrigeration, sterilisation, and equipment. A connection that fails for long periods may not provide those services. A household may have electricity but still cook with smoky fuel because an electric appliance or sufficient power is unaffordable. Distance affects repair time, fuel delivery, network costs, and the availability of trained workers.
Different settlement patterns support different solutions. A dense neighbourhood may suit a shared network. A remote cluster might use a mini-grid with local generation and storage. A scattered home may use an individual system. The technical design has to fit demand, maintenance skills, payment arrangements, local climate, and plans for future growth.
Connection is not the same as access. Count the service people can depend on, not only poles, wires, pipes, or meters installed.
Energy poverty can therefore exist in wealthy countries as well as lower income ones. Cold or overheated homes may result from poor insulation, expensive fuel, low income, unsuitable heating equipment, or insecure housing. Its geography often follows the housing stock and social policy as closely as it follows the energy network.
Energy geography makes invisible systems visible
Energy geography reveals that every energy choice links environments and people across distance. Reading those links carefully turns a fuel, bill, or power station into a map of resources, conversions, networks, rules, labour, risk, and responsibility.
To analyse a place, begin with a useful service such as warm rooms, refrigerated food, or rail travel. Trace backward to the device, network, conversion plant, and primary source. Then trace outward to land, water, emissions, waste, jobs, ownership, and exposure to disruption. Mark where each effect occurs and who can influence it.
Look for the mismatch that controls the system. It may be a windy coast far from demand, a full pipeline with no alternative route, a weak neighbourhood grid, a reservoir exposed to drought, or a household unable to afford an efficient appliance. The most important feature is often the connection between places, not the size of the resource alone.
That habit of tracing connections is geographical thinking in practice. The next time you pass a substation, fill a vehicle, adjust a thermostat, or see turbines on a horizon, identify the source, route, conversion, user, and local cost. The visible equipment is one point in a much larger spatial system.
The takeaway: Energy geography explains where energy comes from, how it reaches users, and why its benefits and burdens differ by place. Follow the whole chain before judging any energy choice.