











What does geography study?
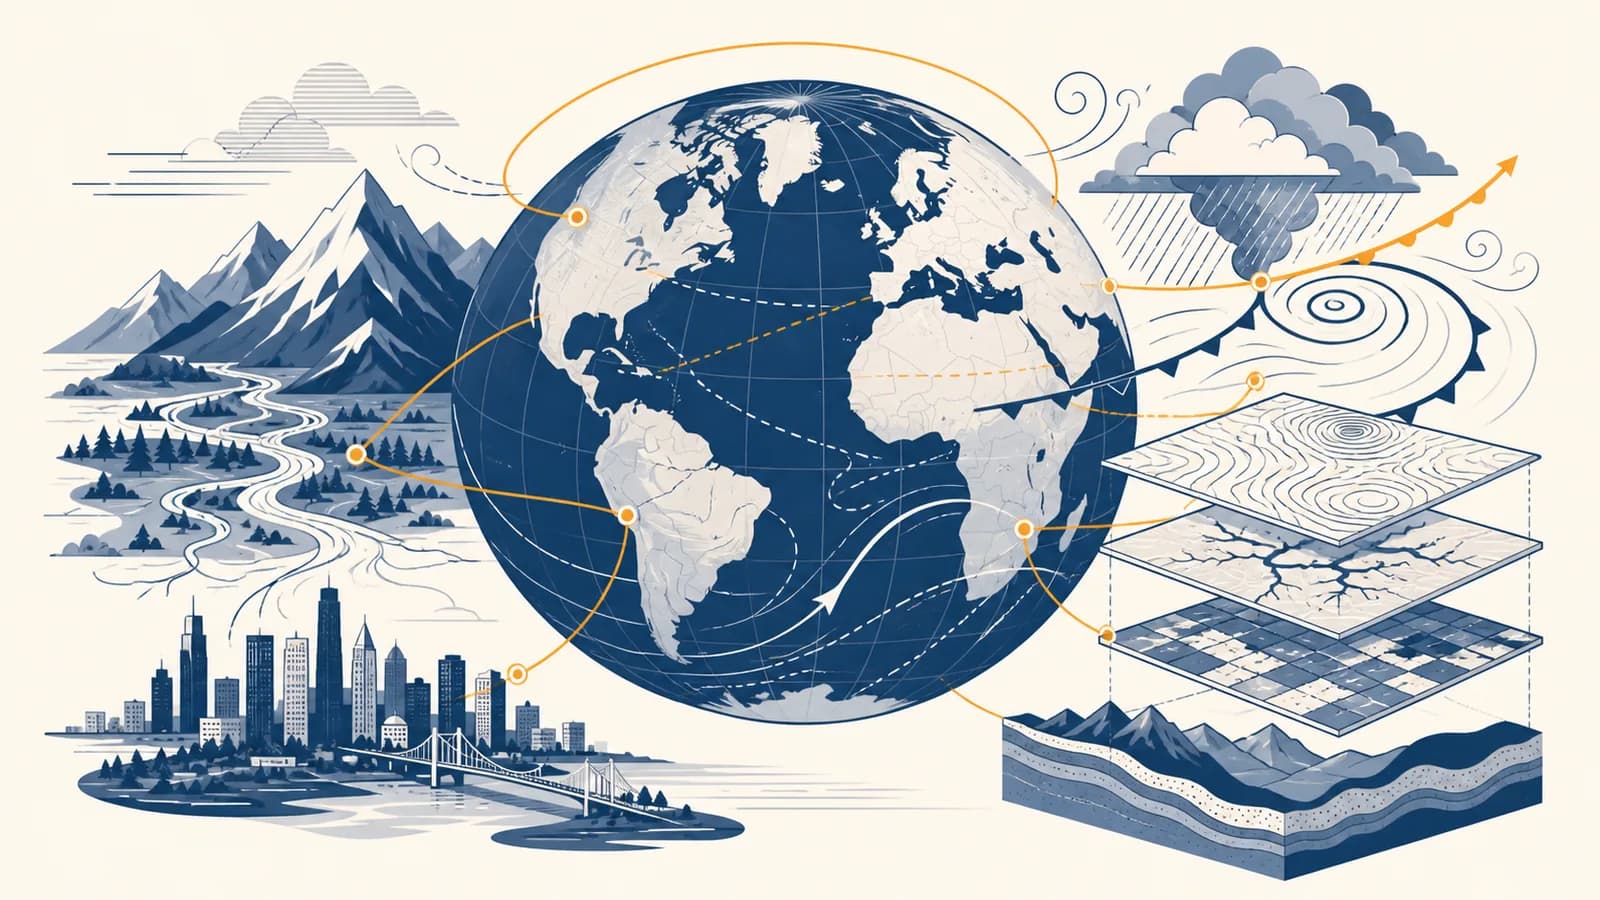
Geography is the study of places, spatial patterns, and relationships that explain how Earth’s environments and human societies are arranged and connected, in the context of a changing planet. It asks where things are, why they are there, how places differ, and what follows when people, materials, organisms, and hazards move between them.
A location is more than a pair of coordinates. It has physical conditions such as elevation, rainfall, soil, and access to water. It also has human conditions such as language, law, wealth, transport, and land ownership. Geographers examine how these conditions combine. A steep valley can restrict road building, but a government may still fund a tunnel because the route links valuable markets. A fertile floodplain can support dense settlement, while also exposing homes and crops to floods.
The subject has three broad concerns. Physical geography studies processes in the atmosphere, oceans, land, water, soils, and living systems. Human geography studies populations, settlements, economies, cultures, and political territories. Geospatial geography provides the methods used to measure, map, and compare both. These concerns overlap whenever a question involves people and an environment, which most geographical questions do.
Geography answers practical questions. Where should a hospital be built so that it serves the most people? Why does one coast erode faster than another? Which neighbourhoods are most exposed to extreme heat? How does a factory closure affect workers in another country? Each question links a pattern on Earth’s surface to processes operating through space and over time.
Physical processes keep remaking Earth’s surface
Earth’s surface is produced by interacting systems: energy drives weather, gravity moves water and rock, plate motion raises mountains, and living organisms alter soils and gases. Physical geography explains these mechanisms and the landforms, climates, habitats, and hazards they create.
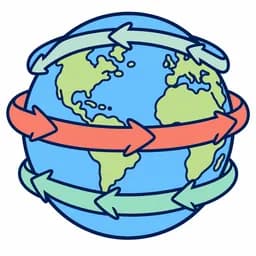
The Sun heats Earth unevenly because the planet is curved, tilted, and covered by surfaces that absorb energy differently. This uneven heating produces pressure differences, winds, ocean circulation, evaporation, clouds, and rain. The study of how air, water, and energy create weather patterns connects a local forecast to planetary circulation. A rainy week is weather. The expected range and seasonal pattern over many years form climate.
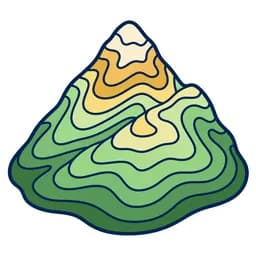
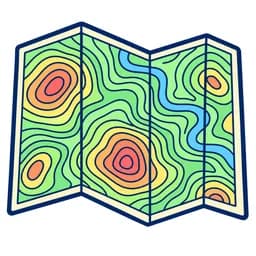
At the surface, rock is weathered into smaller pieces or chemically altered. Rivers, glaciers, waves, and wind erode material, carry it, and deposit it elsewhere. Plate movement folds, faults, raises, and destroys crust. These processes work at different speeds, so terrain shaped by rock, water, wind, and ice records both sudden events and gradual change. A landslide can alter a slope in minutes, while a river valley may deepen through repeated erosion.
Water links the atmosphere, land, oceans, and living things. Rain can infiltrate soil, recharge an aquifer, flow across the surface, enter a river, evaporate, or be taken up by plants. Human withdrawals and dams change those paths. Studying how rivers, aquifers, and demand divide available water therefore requires both physical measurements and knowledge of who controls supply.
Physical systems do not respect chapter boundaries. A volcanic eruption can build land, release gases, bury soil, disrupt flights, and force evacuation. A drought may begin with atmospheric conditions, become an agricultural problem through dry soil, and develop into a social crisis where households lack savings or public support. The hazard is physical; the scale of harm depends partly on society.
How does human geography explain where people live and work?
Human geography explains the spatial organisation of society by examining how people choose, inherit, control, and change places. It studies population, settlement, culture, politics, and economic activity, then connects visible patterns to decisions, institutions, histories, and unequal access to resources.
Population is distributed unevenly. Water supply, climate, terrain, jobs, transport, public services, conflict, and past settlement all affect where people live. Density measures the number of people in a stated area, but an average can conceal empty mountains beside a crowded valley. The question behind why populations cluster in particular places is therefore more useful than density alone.
A district with 120,000 people in 400 square kilometres has an average density of people per square kilometre.
Movement changes that distribution. People move for work, safety, family, education, housing, or a combination of pressures and opportunities. A border, fare, visa rule, language network, or recruitment agency can redirect the flow. Work on migration choices, barriers, and routes distinguishes the reason a person wants to move from the means and permission that make movement possible.
Settlements form systems rather than isolated dots. A village may provide basic services to nearby farms. A regional town may contain a hospital, college, and wholesale market. A major city may link national finance to international trade. As urban populations and built areas expand, the growth and internal structure of cities helps explain commuting, housing pressure, informal settlement, infrastructure demand, and changes in land value.
A bus company is deciding where to add a route. Population totals show possible demand, street maps show feasible paths, travel surveys reveal daily movement, and income data suggests who lacks a car. Geography combines these layers to identify people who are numerous, reachable, and poorly served.
Culture and politics also shape space. Languages spread through migration, schooling, media, and state policy. Borders divide legal authority, yet trade, rivers, pollution, and family networks cross them. Economic activities cluster where firms can reach workers, suppliers, customers, energy, or specialised knowledge. Human geography traces these connections without assuming that every person has equal freedom to choose a location.
People and environments change each other
Human activity changes environments, and environmental conditions shape human choices, but neither side acts alone. Geography studies the feedback between them: resource use alters land, water, and air; those changes then affect health, livelihoods, costs, risks, and future decisions.
A forest can supply timber, store carbon, protect soil, regulate runoff, and provide habitat. Clearing it may create farmland and income, but it can also expose soil to erosion and reduce the landscape’s capacity to slow water. The result depends on the forest, the farming method, land rights, market demand, and enforcement. “People damage nature” is too vague to explain which action caused which change.
Climate change shows the same two way relationship. Burning fossil fuels and changing land cover add greenhouse gases to the atmosphere, strengthening the greenhouse effect. Rising temperatures then alter heat extremes, rainfall patterns, ice, ecosystems, and sea level, with different effects in different places. The geography of causes, exposure, and adaptation asks who emits, who faces harm, and which responses fit local conditions.
Risk is not the same as hazard. A cyclone over an uninhabited ocean is a hazard. Risk grows where people and assets are exposed and vulnerable, and it falls where warnings, buildings, services, and evacuation plans reduce possible harm.
This distinction prevents a common error. Two places can experience similar rainfall, heat, or ground shaking yet suffer very different losses. Building quality, age, health, savings, insurance, transport, government capacity, and trust in warnings affect what happens next. Geography examines those differences rather than treating a natural event as a complete explanation.
Sustainability concerns whether a system can continue without exhausting its material base or shifting unacceptable damage onto other people, places, or future generations. Studying choices that remain workable over time means comparing environmental limits, social needs, and economic tradeoffs. A renewable resource can still be depleted if use exceeds replenishment. A low carbon project can still create conflict if residents lose land without consent.
Scale changes the answer
A geographical claim is only meaningful at a stated scale. A pattern visible across a continent may disappear within one city, while a neighbourhood inequality may be hidden by a national average. Geographers switch scales to test which process explains the evidence.
Consider rainfall. A global map may show broad wet and dry belts associated with atmospheric circulation. A regional map may show wetter mountain slopes and a drier rain shadow. A street level investigation may find puddling beside blocked drains. All three patterns are real, but each has a different cause and requires a different response. These illustrative square study frames show how area grows as each side becomes ten times longer.
Scale also affects data. A census area may contain households with very different incomes, but a map often assigns the entire area one colour based on an average. A satellite pixel combines everything inside its footprint into one measurement. A global model simplifies small processes so that larger patterns can be calculated. The correct scale is the one that matches the question and does not hide the variation needed to answer it.
Time has scale too. A storm unfolds over hours, a migration stream may change over years, and plate movement reshapes continents over millions of years. Short records can mistake a temporary fluctuation for a lasting trend. Very long averages can hide a rapid change that matters to present decisions. Geographers match the observation period to the speed of the process.
Geographers also examine connections across scales. A household’s food bill can change because drought reduces a regional harvest, fuel costs raise transport prices, or a trade rule changes imports. A local outcome may have a distant cause. Scale is therefore both a size of observation and a way to trace how decisions travel through networks.
Maps are arguments made with spatial evidence
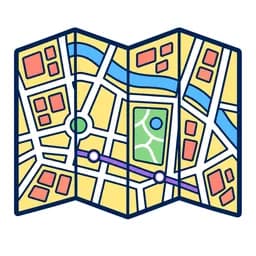
A map is a selective model of space, not a miniature copy of Earth. Its maker chooses a purpose, projection, boundary, scale, symbols, categories, and data source. Those choices reveal some patterns, hide others, and influence the conclusions a reader can draw.
Earth is roughly spherical, while a paper map and most screens are flat. Every flat world map therefore distorts some combination of area, shape, distance, or direction. A projection suited to navigation may enlarge high latitude regions. An equal area projection preserves relative area but changes shapes. Good map use begins by asking what property the projection preserves.
Symbols also make an argument. A map of unemployment might use darker colours for higher percentages, but its message can change if the class boundaries change. Mapping totals can make populous districts dominate, while mapping rates may reveal a different pattern. The craft of selecting, projecting, and symbolising mapped evidence is therefore part design, part measurement, and part honest communication.
Lines, colours, labels, and empty spaces can look like direct facts about the world.
Data, categories, projection, scale, and purpose determine what the map allows a reader to see.
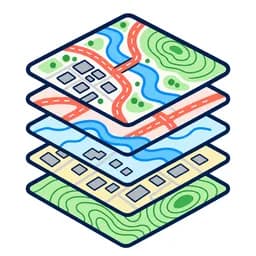
Digital tools extend mapping into analysis. A geographic information system stores features as layers tied to locations. Roads, slopes, land parcels, flood zones, and population can be compared because each layer shares a coordinate system. Layer based geographic analysis in GIS can locate land that meets several conditions, such as being outside a flood zone, near a road, and within an agreed distance of residents.
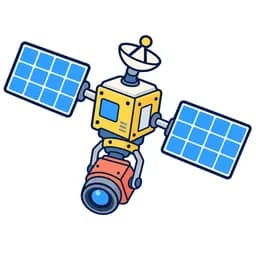
Remote sensors measure reflected or emitted energy without direct contact with the surface. Different wavelengths can reveal vegetation condition, water, heat, clouds, or built materials. Repeated observations show change, but an image still needs interpretation and checking. Work with satellite and aircraft observations of Earth connects pixel values to physical properties and field evidence.
At a scale of , 2 centimetres on the map represents centimetres, which is 1 kilometre on the ground.
Location data is not automatically complete or fair. Phone records represent people who carry connected phones. Official addresses may omit informal homes. Cloud can block an optical satellite view. Old boundaries can mismatch current populations. A skilled geographer records where data came from, when it was collected, what it measures, and whose activities it misses.
How do geographers build an explanation?
Geographers build explanations by defining a spatial question, proposing a cause, collecting suitable evidence, comparing patterns, and testing alternatives. Field observations, interviews, maps, censuses, sensors, experiments, and models contribute different evidence, so strong investigations combine methods that correct one another’s limits.
Name the outcome, place, time period, and unit of comparison. “Why is this river polluted?” becomes testable when the pollutant, river section, and dates are specified.
List plausible causes and the evidence each would produce. Farm runoff, leaking sewers, and industrial discharge should create different chemical or spatial signatures.
Use consistent sampling sites and methods. Record weather, flow, time, and nearby land use so that a change in conditions is not mistaken for a source.
Compare results with predictions, examine exceptions, state uncertainty, and show the pattern at a scale another person can inspect.
Spatial association is a useful clue, but it does not prove causation. If asthma rates are higher near a major road, traffic pollution is one possible mechanism. Housing quality, age, smoking, workplace exposure, and access to diagnosis may also vary across the same area. The investigation must test these alternatives and avoid claiming more than the evidence shows.
Sampling design matters because researchers cannot measure everywhere at every moment. A systematic sample takes observations at regular intervals. A stratified sample ensures that relevant types of place, such as upstream and downstream sites, are represented. A random sample reduces conscious selection bias. The method should reflect how the phenomenon varies.
Geographers often use methods that compare distance, clustering, overlap, and accessibility to test claims. A cluster of disease cases may be compared with water sources. Travel times may show who can reach a clinic. Overlay may identify homes exposed to both floodwater and poor evacuation access. The calculation becomes meaningful only after the variables and assumptions are stated.
To study heat across a town, a team places calibrated temperature sensors in shaded, ventilated locations representing dense streets, parks, industrial land, and suburbs. Measurements are taken at the same times. Surface materials, tree cover, wind, and building form are recorded so the pattern can be explained rather than simply mapped.
Uncertainty is information, not an embarrassment. A boundary may be disputed, a sensor may have an error range, a respondent may withhold information, or a future scenario may depend on unknown policy. Clear work distinguishes measured values from estimates, correlation from cause, and a model’s output from a prediction guaranteed to occur.
Geography is commonly mistaken for place name recall
Knowing countries, capitals, rivers, and mountains provides useful reference points, but recall alone is not geography. The subject uses location as evidence, then explains patterns through physical processes, human decisions, networks, histories, and interactions between society and the environment.
Geography is a catalogue of facts about where places and features are located.
Geography asks why a pattern exists there, how it changes, who is affected, and which evidence could test the explanation.
A student who memorises that a port is busy knows a fact. A geographical explanation examines its sheltered water, channel depth, rail and road links, nearby industries, shipping routes, labour force, investment, and political history. It also asks why traffic increased or declined and how the port affects neighbourhoods, wetlands, and distant suppliers.
Another mistake is to divide nature and society too neatly. Floodwater follows physical laws, yet flood losses reflect where buildings were allowed, how warnings were communicated, which households could leave, and how drainage was maintained. Human choices do not cancel the physical process. They alter exposure and vulnerability.
Maps can create a third misunderstanding: that mapped boundaries and categories exist exactly as drawn. Coastlines change with scale and tide. Neighbourhood boundaries may be informal. Ecosystems blend into one another. Political borders may be disputed. Categories remain useful, but the geographer asks who defined them, for what purpose, and how much variation they conceal.
Do not confuse a spatial match with a cause. Two patterns can overlap because one causes the other, because both share another cause, or by chance. A map generates a hypothesis; further evidence tests it.
The subject is also more than environmental concern. Environmental questions are prominent because they involve space, resources, and risk, but geographers also investigate voting, retail, language, borders, finance, care, tourism, crime, and digital networks. What makes these geographical is attention to location, scale, movement, connection, and uneven distribution.
How does geography connect with other school subjects?
Geography connects natural science, social science, mathematics, computing, and the humanities by giving them a shared spatial question. It borrows their methods, then asks how a process varies by place, moves through a network, changes with scale, or produces unequal outcomes.
Physics helps explain radiation, pressure, waves, and the motion of water and air. Chemistry explains weathering, soil nutrients, salinity, acidity, and pollutants. Biology explains ecosystems, adaptation, food webs, and species distributions. Geography places these processes in actual environments where elevation, climate, land use, and human intervention vary together.
Economics examines production, prices, trade, and incentives. Geography adds distance, transport cost, resource location, border effects, and regional inequality. History explains how past events shaped institutions and settlement. Geography shows how those histories remain visible in property lines, transport routes, language regions, and uneven investment.
Politics and law matter because states define borders, regulate land, grant permits, collect taxes, and allocate services. A river basin can cross several jurisdictions, so physical water flow and legal authority do not line up. Ethical questions follow: who receives protection, who bears pollution, whose knowledge counts, and who can challenge a planning decision?
Mathematics supports scale, coordinates, rates, probability, statistics, and modelling. Computing manages large spatial datasets and automates comparisons. Art and design make maps readable without distorting the message. Language skills matter in interviews, place descriptions, policy documents, and clear explanations of uncertainty.
This combination appears in many occupations. An urban planner compares housing, transport, hazards, and public needs. An epidemiologist maps disease and access to care. A conservation worker measures habitats and land pressure. A logistics analyst traces goods through ports and warehouses. A journalist checks where an event occurred and which wider system connects it to an audience.
Geographical thinking turns location into better decisions
Geographical thinking improves decisions by connecting a place to the processes, people, networks, and scales that shape it. It replaces a single map or average with a tested explanation, then makes the tradeoffs and affected groups visible.
A good geographical decision starts with a precise outcome. “Build somewhere safe” is too broad. Safety from which hazard, for how long, and for whom? It identifies the relevant area and time period, compares alternatives with consistent evidence, checks effects beyond the site, and states uncertainty. A flood barrier may protect one bank while raising water elsewhere. A new road may shorten some trips while dividing a habitat or neighbourhood.
The same habits improve daily judgement. A cheap home may carry a long commute, poor service access, or flood exposure. A food label may hide a supply chain spanning farms, processors, ports, and laws. A dramatic hazard map may show possibility rather than likely depth or timing. Asking about source, scale, missing groups, and mechanism makes each claim easier to test.
The takeaway: Geography explains why places differ, how they are connected, and what changes when physical processes and human choices meet. Its tools make spatial patterns visible; its questions turn those patterns into evidence for action.
The field holds together through a small set of disciplined questions. Where is the pattern? At what scale and over what period? What process could produce it? Which people or environments are exposed? What evidence might disprove the explanation? Those questions lead from observation to analysis without pretending that every place works the same way.
Geography is useful because decisions always happen somewhere. Land has neighbours, water flows, air moves, people travel, and costs cross boundaries. Understanding those connections does not remove disagreement, but it shows what is being traded, who gains or loses, and which claims rest on evidence. That is how knowledge of place becomes a responsible account of the world.