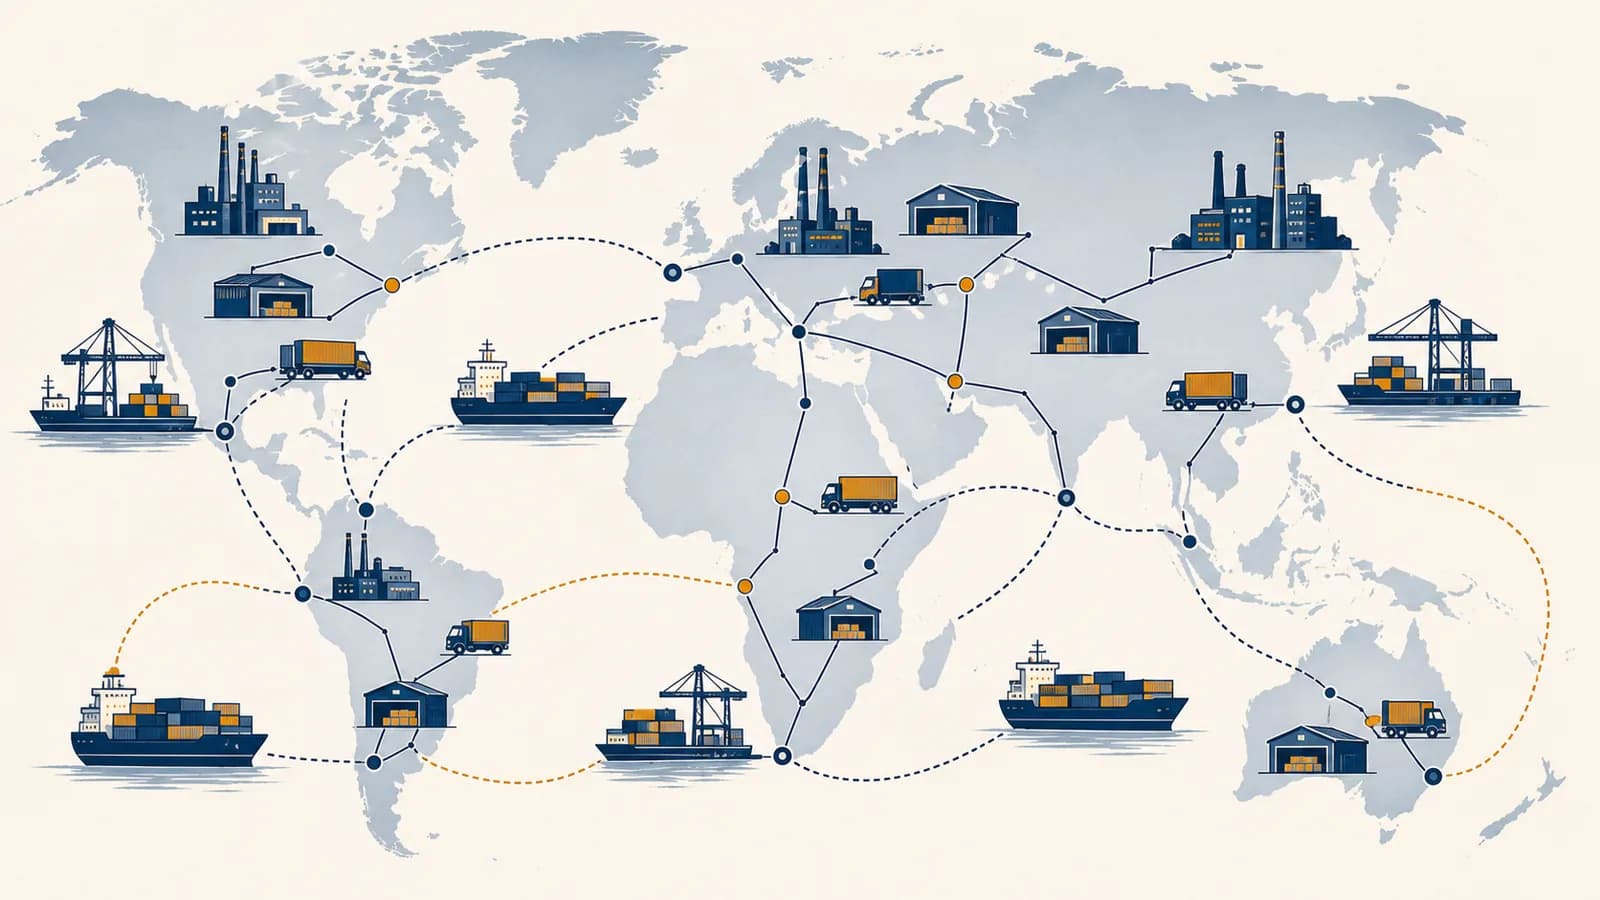
Global supply chains are networks that move materials, components, information, and finished goods between places, in the context of worldwide production and trade. A global supply chain connects suppliers, factories, ports, warehouses, shops, and customers across national borders. It exists because resources, skills, factories, energy, and buyers are unevenly distributed across Earth. Firms organize these links to make a product at an acceptable cost, quality, and speed. Geography explains why each activity happens where it does, how distance and borders affect it, and why a disruption in one location can change prices and production somewhere else.
What a global supply chain actually is
A global supply chain is the full system of organizations, places, transport links, contracts, data, and decisions required to turn raw materials into a product and deliver it across borders. It includes physical movement and the information that controls that movement.
A chain begins before anything enters a factory. A phone, for example, depends on mined ores, processed metals, glass, plastics, semiconductor materials, software, assembly, packaging, transport, retail, repair, and eventual recycling. Some stages may occur in one country, while others are spread across several regions. The product follows a route shaped by geology, wages, technical knowledge, trade rules, existing industrial clusters, and access to customers.
The word chain is useful, but it can also mislead. Production rarely follows one neat line. A factory may buy the same part from several suppliers, while one supplier sells to many factories. Ports, logistics firms, banks, insurers, customs agencies, and software platforms connect those firms. The result is closer to a web with branching paths than a row of links.
Three kinds of flow run through this web. Goods usually move toward the customer. Money usually moves back toward suppliers. Information moves in both directions: orders, forecasts, designs, tracking updates, quality reports, customs records, and payment instructions. A delay in any one flow can stop the others. A component sitting at a border without the correct document is physically close to the factory but operationally unavailable.
How supply chain stages work
Supply chain stages work by dividing production into tasks, assigning each task to a suitable place, and coordinating the handoffs. Demand forecasts trigger orders, suppliers schedule work, carriers move loads, customs authorities clear them, and distributors position stock near buyers.
A firm estimates what customers will buy, where they will buy it, and when. It compares that demand with factory capacity, supplier capacity, transport space, and available inventory.
Buyers select suppliers, agree specifications, negotiate prices, and set delivery terms. They also decide if a part should have one source or several.
Suppliers convert inputs into materials or components. Tests check dimensions, performance, safety, and consistency before the next stage accepts the output.
Carriers consolidate cargo, choose routes, transfer it between truck, rail, ship, or aircraft, and present the required records to border authorities.
Warehouses receive goods, record their location, assemble orders, and send smaller shipments to factories, shops, or homes.
Damaged, unwanted, or used products may travel backward for repair, parts recovery, recycling, or safe disposal. This reverse flow is also part of the chain.
Each handoff has a lead time, which is the time between placing a request and receiving the result. Lead time includes more than travel. A part may wait for a production slot, inspection, loading, a vessel departure, customs release, or space on a delivery vehicle. Managers therefore track both movement time and waiting time.
A bicycle company expects to sell 1,000 bicycles in June. It needs 2,000 wheels, so its purchasing system orders that quantity early enough for wheel production, sea transport, customs clearance, and final assembly. If the supplier delivers only 1,800 acceptable wheels, the bicycle factory can complete at most 900 bicycles, even if every frame, brake, and seat arrives on time.
This is why supply chain control focuses on dependencies. A cheap item can stop an expensive product if there is no substitute. Firms use bills of materials to list every required input, inventory systems to record what is available, and production schedules to match parts with labor and machines. The work is a repeated calculation of what is needed, what exists, what is moving, and what might fail.
How geography decides where each stage happens
Geography decides supply chain locations through the uneven distribution of resources, workers, infrastructure, energy, knowledge, laws, and customers. Firms compare these place-based conditions, then balance production cost against transport time, reliability, market access, and political risk.
Raw material stages are often tied to physical geography. An ore must be mined where the deposit exists. Crops depend on climate, soil, water, and growing seasons. Fishing depends on marine ecosystems and access rules. These constraints connect supply chains to how seas support resources, routes, and livelihoods.
Manufacturing is more mobile, but it is not free to go anywhere. A semiconductor plant needs specialized workers, reliable electricity and water, technical suppliers, transport, and large investment. A garment factory needs workers, machinery, fabric suppliers, buyer relationships, and export connections. Once many related firms gather in one area, they form an industrial cluster. Shared skills, repair services, suppliers, and knowledge make that place more attractive to the next firm.
Distance matters, but travel time and cost matter more than straight-line kilometres. Two cities may be close on a map yet poorly connected by roads or border procedures. A more distant port with frequent services can be functionally nearer. Geographers call this idea relative distance: places are separated by the effort, time, or cost of reaching them, not only by physical space.
Government policy changes location decisions as well. Tariffs add a charge to imports. Quotas limit quantities. Product standards determine what can enter a market. Free trade agreements can reduce some barriers between members. Firms may place final assembly inside a market to avoid a tariff, meet a local-content rule, or shorten delivery. The map of production is therefore partly physical and partly political.
How transport and logistics connect distant places
Transport moves cargo between supply chain stages, while logistics plans the route, timing, storage, documents, and transfers. Firms select modes according to the cargo's value, weight, volume, urgency, handling needs, and access to suitable infrastructure.
Ships carry large loads over long distances, so sea transport suits heavy or bulky goods that can tolerate longer trips. Aircraft offer speed for urgent, light, or high-value goods, but capacity costs more. Rail can move large inland loads efficiently along fixed corridors. Trucks provide flexible collection and delivery, especially at the first and final parts of a route. Many international shipments use several modes.
| Mode | Best suited to | Main constraint |
|---|---|---|
| Ship | Large volumes, containers, fuel, ores, and grain | Slower service and dependence on ports and sea routes |
| Air | Urgent, perishable, light, or high-value cargo | High cost and limited capacity |
| Rail | Heavy inland freight on established corridors | Fixed networks and terminal transfers |
| Truck | Flexible door-to-door collection and delivery | Road congestion, driver limits, and smaller loads |
Containerization makes transfers easier because the cargo stays inside a standard box while cranes move that box between ship, train, and truck. It reduces repeated handling of individual packages. Standardization does not remove delay, however. Containers still need space on vehicles, terminal equipment, documents, and people to move them.
If 100 parts cost $8 each, freight is $120, insurance is $20, tariffs are $80, and handling is $30, total landed cost is $1,050, or $10.50 per part.
The landed-cost example shows why the cheapest factory price may not produce the cheapest usable input. A buyer also considers damage, delay, minimum order size, exchange rates, and the cost of holding extra stock. Route design is an economic choice made on a geographic network.
Energy links deserve special attention because fuel and electricity are both production inputs and transport inputs. A refinery problem can affect fuel supply, freight charges, and factory operations at once. The page on how energy resources shape power and trade develops that connection.
Global supply chains versus global value chains
A global supply chain tracks the movement and coordination of inputs and products, while a global value chain tracks where economic value is added and who captures it. They describe the same production system from different angles, so they overlap without meaning exactly the same thing.
Which supplier makes the component? Where is inventory held? Which port and carrier will move it? How long will delivery take? What can interrupt the flow?
Which activities create design, performance, convenience, or brand value? Who owns the technology? Which firms have bargaining power? Where do wages, profits, and taxes accrue?
Consider a shoe. The supply chain view follows rubber, fabric, laces, packaging, assembly, freight, and retail stock. The value chain view asks why design, marketing, distribution, or brand ownership may command more revenue than physical assembly. A place can handle a large volume of production yet capture a small share of the final value.
The distinction also explains why moving a factory does not transfer an entire industry. Designs, patents, skilled technicians, quality routines, finance, sales networks, and supplier relationships may remain elsewhere. Governments seeking more benefit from trade often try to develop local skills and supplier capacity, not simply attract a final assembly line.
How inventory trades efficiency for protection
Inventory protects production and sales from uncertain timing, but it also ties up money and requires storage. Firms choose stock levels by balancing the cost of running out against the cost of buying, financing, handling, insuring, and possibly discarding extra goods.
Cycle stock covers ordinary demand between deliveries. Safety stock is an added buffer against demand changes or late supply. Pipeline inventory is stock already moving between locations. A product aboard a ship belongs to someone and has value, even though it cannot yet be sold or used at its destination.
A workshop uses 20 filters per day, expects a 5 day lead time, and keeps 30 as safety stock. It reorders when stock reaches filters.
That calculation is deliberately simple. Real demand and lead time vary, so planners use past data, current orders, supplier performance, and judgment. Perishable food creates a special constraint: too little stock means empty shelves, but too much becomes waste. Cold storage and refrigerated transport slow spoilage, yet they require continuous energy and careful temperature control. These mechanisms connect distribution to the geography of reliable access to food.
Inventory is stored time. A buffer gives a firm time to respond when supply is late or demand rises, but every buffer has a financial and physical cost.
Just-in-time production aims to receive inputs close to the moment they are needed. It can reduce storage and expose quality problems quickly. It also makes accurate timing more important. Just-in-case planning keeps larger buffers or spare capacity. Most firms use a mixture, applying more protection to items that are hard to replace, slow to obtain, or capable of stopping the whole operation.
How disruptions spread through the network
A supply chain disruption spreads when one delayed or lost input prevents another stage from operating, causing missed output, changed orders, and new pressure elsewhere. The effect depends on substitutability, inventory, spare capacity, information quality, and the network's alternative routes.
Some shocks damage supply directly. Floods can close factories and roads. Drought can reduce river depth or crop output. Earthquakes can damage ports, power lines, and industrial sites. Other shocks alter demand, labor availability, trade permission, cyber systems, or finance. Their geographic reach is not equal. A hazard becomes a global production problem when it strikes a highly connected node or a source that is difficult to replace.
A resin plant stops after a storm. A packaging supplier cannot obtain enough resin, so it ships fewer food containers. Food processors slow their lines because approved containers are missing. Distributors receive fewer finished products, while retailers seek alternatives. The original physical damage occurred at one plant, but contracts and material dependencies carried the effect outward.
Responses can produce a second wave. A worried buyer may order more than it needs from several suppliers, hoping that at least one delivery arrives. Suppliers see the larger orders and expand their own requests. Later, duplicate deliveries arrive and buyers cancel. This amplification of small demand changes is called the bullwhip effect.
The bars show arithmetic, not measured industry data. The example isolates the mechanism: each stage interprets the order it receives, adds a buffer, and passes a larger signal upstream. Shared sales data, smaller and more frequent orders, stable pricing, and honest capacity information can reduce this distortion.
Resilience means the ability to keep functioning, adapt, and recover. Firms can qualify backup suppliers, hold targeted safety stock, maintain spare capacity, redesign a product to accept substitute parts, or prepare alternate routes. Each measure costs money or management time. The sensible goal is not to remove every risk, which is impossible, but to understand dependencies and protect the failures with the greatest consequences.
How supply chains show up in jobs and daily decisions
Supply chains appear in purchasing, factory work, logistics, customs, retail, finance, software, public policy, and household shopping. People meet them through delivery estimates, product availability, origin labels, recalls, price changes, workplace schedules, and decisions about repair or replacement.
A procurement specialist compares suppliers and contracts. A production planner turns orders into factory schedules. A freight forwarder organizes international movement across carriers. A customs broker prepares classifications and records. A warehouse supervisor controls receiving, storage, picking, and dispatch. A data analyst looks for delays and mismatches. Inspectors test products. Lawyers interpret trade and labor rules. Geographers and mapping specialists examine routes, hazards, markets, and access.
The same system reaches a household. A delivery date is a promise based on inventory location, warehouse workload, carrier capacity, distance, and uncertainty. A product recall depends on traceability, the records that connect a batch of inputs to finished products and destinations. A country-of-origin label gives one piece of information, but it may not reveal where every component was made or where most value was created.
The immediate purchase costs less. The label may leave transport, durability, repair access, working conditions, waste, and pollution outside the visible price.
The item may last longer, use less energy, accept replacement parts, or have local repair support. Those features can change the cost over its useful life.
A consumer cannot investigate every supplier behind every purchase. Better questions are still possible. Can the product be repaired? Are replacement parts available? Does the seller explain material origins or labor standards with specific evidence? Is a certification independent, and what exactly does it verify? A precise claim such as recycled metal content is more informative than a vague green label.
Public decisions also shape everyday supply. Governments plan ports, roads, power grids, border systems, and emergency stocks. Schools and hospitals write purchasing rules. Firms choose delivery speeds and return policies. Households decide how much food or medicine to keep. Each choice changes cost, waste, access, or exposure to delay.
Four mistakes people make with global supply chains
Four common mistakes are treating the chain as a straight line, assuming the lowest factory price means the lowest total cost, blaming every shortage on transport, and confusing resilience with self-sufficiency. Each mistake hides a different part of the mechanism.
1. Drawing one route and ignoring the network
A single route leaves out backup suppliers, subcontractors, shared utilities, data providers, and return flows. It can also hide a common dependency. Two apparent suppliers may both rely on the same chemical plant, port, or power grid. Good mapping asks what sits behind each supplier and what alternatives are genuinely independent.
2. Comparing purchase prices instead of total costs
A quoted unit price excludes many costs that arise before the input can be used. Freight, tariffs, inspection, damage, financing, inventory, and late delivery all matter. Quality variation can create rework or warranty claims. A more expensive source may cost less overall if it is closer, faster, more consistent, or easier to coordinate.
3. Assuming an empty shelf means a transport failure
A shortage can begin with raw material loss, factory downtime, a sudden rise in demand, missing workers, a failed payment, a regulatory hold, poor forecasting, or deliberate allocation. Transport may be working exactly as planned but carrying less product because an earlier stage produced less.
4. Treating resilience as producing everything at home
Domestic production can shorten some routes, yet it can concentrate risk inside one country and raise dependence on imported machinery or materials. Resilience comes from suitable buffers, visibility, adaptable designs, trusted partners, and real alternatives. International diversification can sometimes provide better protection than one national source.
A second supplier is not automatically a backup. If both suppliers use the same upstream source, border crossing, transport corridor, or software system, one event can still stop both.
These errors share a cause: they focus on an object rather than the relations that produced it. Supply chain analysis follows dependencies, incentives, and flows across scales. It checks the mine behind the metal, the energy behind the factory, the documents behind the border crossing, and the forecast behind the order.
How can a supply chain be traced?
A supply chain can be traced by linking each product or batch to records of its materials, suppliers, processing sites, transport events, owners, and destinations. Effective traceability uses consistent identifiers, reliable data entry, verification, and permission to share relevant information.
Barcodes, serial numbers, batch codes, shipping documents, sensor readings, and inventory records can create a chain of custody. The technology does not guarantee truth by itself. A false origin entered into a database remains false, and a missing subcontractor remains invisible. Audits, tests, document checks, and site visits help confirm that the records match physical events.
Traceability serves several purposes. It can identify which batch needs recalling, verify a regulated material, show where a delay occurred, or support a claim about origin. Full transparency is harder because firms may protect prices, designs, and supplier identities. A useful system decides which facts must be visible to regulators, buyers, customers, or the public, then verifies those facts at the appropriate level.
Can global supply chains be sustainable and fair?
Global supply chains can reduce harm and distribute benefits more fairly, but distance alone does not determine the result. Outcomes depend on production methods, energy sources, transport modes, product life, wages, working conditions, purchasing contracts, enforcement, waste, and repair.
A nearby product can have a heavy impact if it uses polluting energy or wastes material. A distant product can sometimes move efficiently in a large sea shipment. The right comparison follows the product's life cycle: material extraction, processing, production, transport, use, repair, and disposal. It also asks who bears pollution or dangerous work and who receives the income.
Buyers influence conditions through order size, deadlines, prices, contract length, and last-minute changes. A code of conduct has limited value if the buyer also demands a price and schedule that make safe compliance difficult. Governments set labor, environmental, customs, and reporting rules. Workers, unions, communities, journalists, researchers, and customers can expose gaps between a written standard and actual practice.
Material choice, component count, durability, repair access, and packaging determine which suppliers and recovery options are possible.
Prices, deadlines, inspections, worker protections, energy, and waste controls affect how goods are made and who carries the risk.
Energy use, maintenance, returns, reuse, recycling, and disposal determine whether value is preserved or thrown away.
Circular supply chains try to keep products and materials in use through maintenance, reuse, refurbishment, remanufacturing, and recycling. This requires reverse logistics, product information, collection points, inspection, and markets for recovered materials. Recycling is one option, not the whole system. Keeping a working product in service often preserves more of the labor and material already invested in it.
Global supply chains make geography visible
Global supply chains make geography visible because every product connects environments, settlements, borders, infrastructure, economies, and political choices. Reading those connections reveals how places depend on one another and why changes at one scale produce effects at another.
Choose an object you used today and read its label. List its likely raw materials, processing stages, energy needs, transport modes, workers, and final destination. Then mark where your evidence ends and your assumption begins. That gap is important: it shows which parts of the network are visible and which are hidden.
Next, test one disruption. Close a port, remove a raw material, delay a border clearance, or double demand. Ask which stage stops first, which substitute is possible, how much inventory buys time, and who pays the extra cost. This turns a product map into a geographic explanation of causes and consequences.
The takeaway: A global supply chain is a place-based system of flows and dependencies. To understand one, trace the product, information, money, timing, power, and risk together.
This method also shows how geography connects places, environments, economies, and decisions. Notice the next delivery estimate, origin claim, price change, or empty shelf you encounter. Behind it is a map of resources, routes, rules, and people that can be investigated rather than guessed.