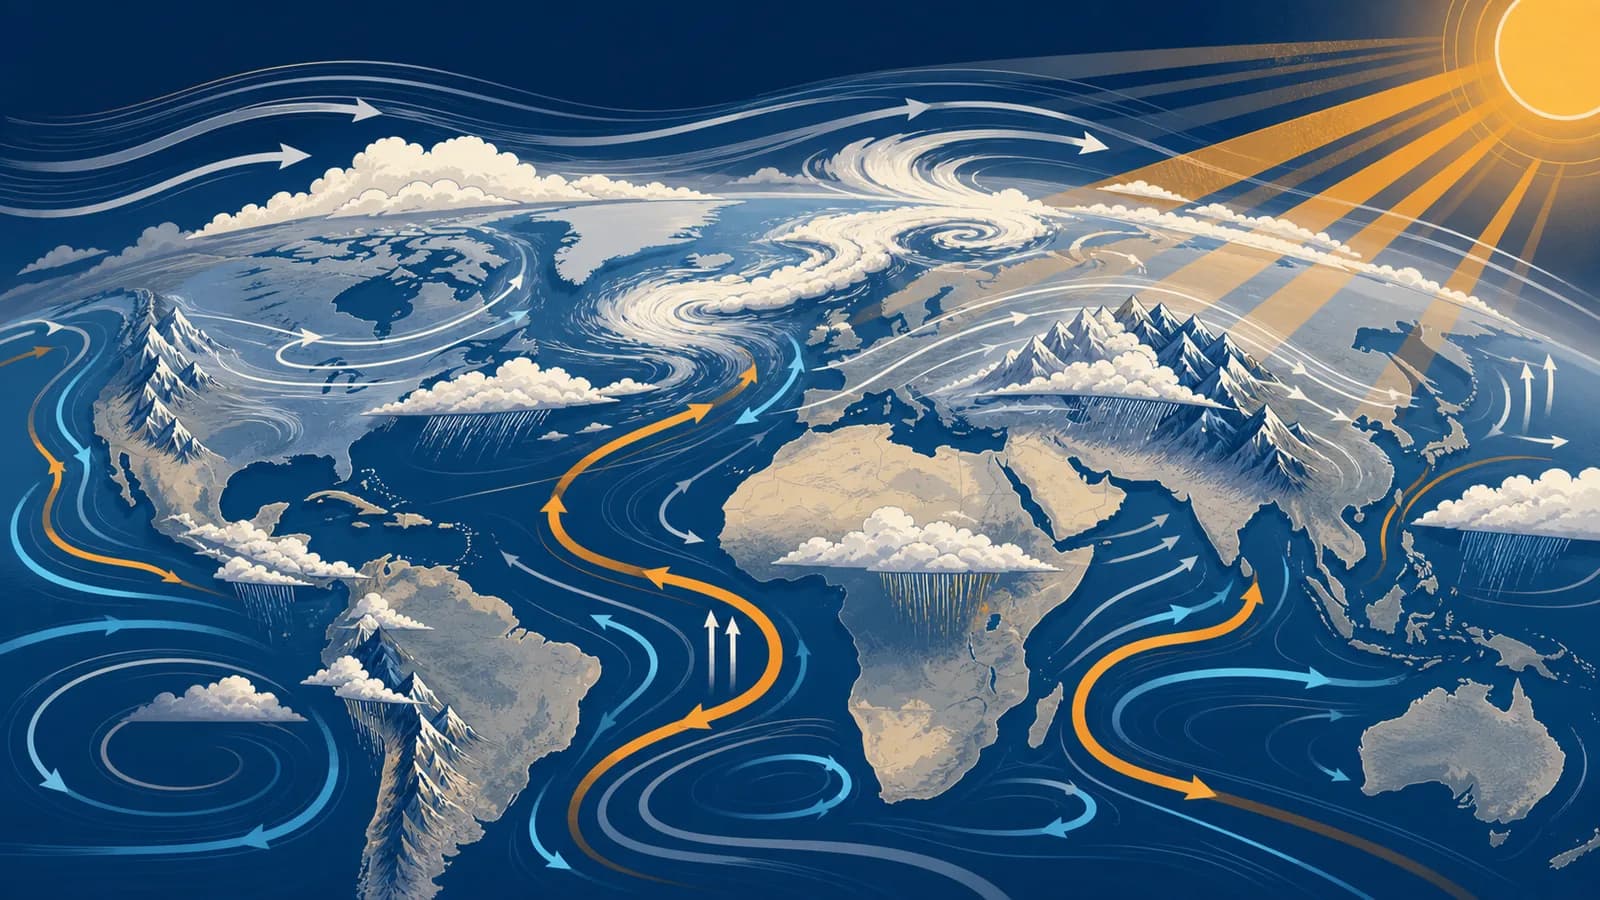
Climate systems and weather patterns are interacting physical processes that move energy and water through the atmosphere, oceans, ice, land, and living things, in the context of physical geography. Climate describes the long-term range and rhythm of conditions in a place, while weather describes the atmosphere at a particular time. Searches for “how climate systems work,” “global weather patterns,” and “weather versus climate” all lead to the same engine: uneven solar heating creates pressure differences, circulation, clouds, rain, and recurring regional climates. The system exists because Earth must continually absorb solar energy and release energy to space.
A wet week does not define a rainforest climate, and one blizzard does not disprove global warming. Each event is a brief expression of a connected system. Sunlight warms the tropics more directly than the poles. Air and ocean currents redistribute some of that heat. Water evaporates, travels, condenses, and falls. Mountains, coastlines, vegetation, ice, and cities alter the result at scales ranging from a street to a continent.
What the climate system actually is
The climate system is the connected set of Earth components that exchange energy, water, gases, and momentum over time. Its main parts are the atmosphere, hydrosphere, cryosphere, land surface, and biosphere; a change in one part can alter every other part.
The atmosphere carries heat and moisture in moving air. The hydrosphere includes oceans, lakes, rivers, groundwater, and water vapour. The cryosphere includes snow, sea ice, glaciers, ice sheets, and frozen ground. The land surface stores and releases heat, channels water, and supplies dust. The biosphere changes flows of carbon, water, and energy through plants, soils, animals, and microbes.
These parts do not respond at the same speed. Air can change temperature within hours. The upper ocean changes more slowly because water stores much more heat than an equal mass of air. Deep ocean water and large ice sheets can preserve the effects of past conditions for centuries or longer. Climate therefore has memory, while weather can change sharply from one day to the next.
Climate is not a fixed average. It includes typical values, seasonal cycles, year-to-year variation, extremes, and long-term trends. A place with a mild average temperature may still face damaging heatwaves and frosts. A useful climate description therefore includes the distribution of conditions, not only the middle of that distribution.
How energy moves through the climate system
Energy enters mainly as shortwave sunlight, is reflected or absorbed, moves through air and water, and leaves as longwave infrared radiation. Climate changes when the incoming and outgoing flows become unequal, or when circulation redistributes energy differently across Earth.
Earth is spherical, so sunlight strikes different latitudes at different angles. Near the equator, a beam is concentrated over a smaller surface area. Near the poles, the same beam spreads over a larger area and travels through more atmosphere. The geographic coordinate system defines the equator as 0 degrees and each pole as 90 degrees. Astronomical measurement places Earth’s axial tilt near 23.5 degrees, so the polar circles lie near 66.5 degrees. That tilt produces the seasons.
Clouds, bright deserts, snow, and ice reflect part of the incoming sunlight. Dark ocean and forest surfaces absorb a larger share. The fraction reflected is called albedo. Absorbed energy warms the surface, which transfers energy upward by infrared radiation, direct contact with air, rising currents, and evaporation.
Evaporation hides energy as latent heat. When water vapour condenses into cloud droplets, that energy is released into the air. This transfer powers thunderstorms and helps tropical cyclones intensify over warm water. The water cycle is therefore an energy transport system as well as a movement of water.
The International Astronomical Union defines a nominal solar irradiance of 1,361 W/m² at Earth’s distance, giving a spherical average of about 340 W/m². Division by four follows from the area of a disk compared with the area of a sphere.
Greenhouse gases absorb and emit infrared radiation at particular wavelengths. This slows the direct loss of energy to space and keeps the surface warmer than it would be in an atmosphere transparent to infrared radiation. Adding greenhouse gases raises the altitude from which much outgoing energy escapes. Because higher air is usually colder and emits less energy, the lower atmosphere and surface warm until outgoing energy again approaches incoming energy.
Energy balance sets the direction of change. If Earth absorbs energy faster than it emits energy, the climate system gains heat. If it emits faster than it absorbs, the system loses heat.
How clouds can cool and warm Earth
Clouds cool Earth by reflecting sunlight and warm it by absorbing and emitting infrared radiation. Their net effect depends on height, thickness, droplet or ice properties, time of day, and the brightness and temperature of the surface below.
Thick, low clouds are often strong reflectors. Their tops are not extremely cold, so their infrared warming effect is limited compared with their reflection of sunlight. Thin, high clouds reflect less sunlight but have cold tops that emit less infrared energy to space, which can produce a net warming influence.
This double role makes cloud feedback one of the more demanding parts of climate modelling. A model must represent rising air, turbulence, condensation, ice formation, droplet sizes, precipitation, and interaction with radiation, often at scales smaller than its grid. Scientists test the result against satellites, ground instruments, aircraft observations, and the behaviour of weather systems.
How global circulation creates weather patterns
Global circulation turns uneven heating into broad belts of rising air, sinking air, prevailing winds, and storm tracks. Pressure gradients start the motion, Earth’s rotation deflects it, and friction and continents reshape it into the weather patterns observed on maps.
Warm air near the tropical surface expands, becomes less dense than surrounding cooler air, and tends to rise. Rising air enters lower pressure, expands, and cools. If it cools to saturation, water vapour condenses into droplets or ice crystals. This is why persistent rising motion often produces cloud and heavy rain near the equatorial convergence zone.
Warm columns of air expand, while cold columns contract. Pressure surfaces tilt, producing forces that accelerate air.
Near the surface, air generally moves away from higher pressure and toward lower pressure, although rotation and friction bend its path.
The Coriolis effect turns moving air to the right in the Northern Hemisphere and to the left in the Southern Hemisphere.
Rising air favours clouds and precipitation. Sinking air warms as it compresses, lowering relative humidity and discouraging cloud growth.
The familiar three-cell model divides each hemisphere into Hadley, Ferrel, and Polar cells. It is an idealized average, not three smooth conveyor belts. Hadley circulation is clearest: air rises in the tropics, moves poleward high in the troposphere, sinks in the subtropics, and returns equatorward near the surface as the trade winds.
At middle latitudes, large bends in the jet stream and rotating low pressure systems do much of the heat transport. These waves develop where strong horizontal temperature contrasts store potential energy. Fronts mark boundaries between air masses with different temperatures and humidity. A cold front can lift warm air quickly and produce a narrow band of intense rain; a warm front usually forces a gentler rise over a broader area.
Weather versus climate
Weather is the observed state of the atmosphere over minutes to days, while climate is the statistical pattern of weather over decades and longer. They use many of the same variables, but they answer different questions about timing, range, and probability.
Will a low pressure system bring rain to Manchester tomorrow afternoon, and how strong might the wind become?
How often does Manchester receive winter rain, how variable is it, and is that distribution changing over several decades?
A weather forecast estimates one developing sequence from the atmosphere’s present state. A climate projection estimates how the probabilities of many possible sequences change under specified conditions, such as a particular greenhouse gas pathway. Forecast skill falls with time because tiny errors in the initial state grow. Climate statistics can still be estimated beyond that limit because energy balance, seasonal sunlight, and boundary conditions constrain the range of possible weather.
Imagine a loaded die. Predicting the next roll is an event forecast. Measuring that six appears more often than expected identifies a change in the distribution. In the same way, climate change can make a type of heat event more frequent or intense without dictating the exact temperature on a named day years ahead.
A council deciding whether to clear roads tomorrow needs a weather forecast. The same council choosing drainage pipe sizes and locations for new housing needs rainfall records, estimates of rare extremes, and climate projections. Confusing the timescales can waste money or leave people exposed.
How oceans and land reshape climate patterns
Oceans store and move heat, while continents warm, cool, and dry more quickly. Coastlines, mountains, soils, vegetation, and ice modify air flow and water supply, so places at the same latitude can have very different climates and seasonal rhythms.
Water has a high heat capacity and mixes vertically, so an ocean surface changes temperature more slowly than dry land. Coastal areas often have smaller daily and seasonal temperature ranges than continental interiors. Ocean currents also carry heat. Warm currents can make nearby air milder and moister, while cold currents can stabilize lower air, suppress rainfall, and help fog form.
The mechanics of currents and coastal effects connect directly with how oceans shape coasts and regional climates. Sea surface temperature matters because it controls evaporation and the energy available to the lower atmosphere. Winds push surface water, Earth’s rotation bends the transport, and density differences drive slower circulation at depth.
Continents create stronger temperature contrasts. In summer, a large landmass can heat enough to draw moist air inland. In winter, the same land can cool and support outward flow. A monsoon is a seasonal reversal or major shift in winds linked to changing pressure and heating patterns. It is not simply a word for heavy rain, although the wet phase can deliver intense rainfall.
Mountains force air upward, redirect winds, and separate wet windward climates from dry leeward climates. Soil moisture and vegetation also matter. Wet soil uses more incoming energy for evaporation, while dry soil directs more energy into surface heating. Plants move water into the air through transpiration and roughen the surface, changing turbulence and moisture recycling.
Ice adds a feedback. Warming melts bright snow or sea ice, exposing darker ground or ocean that absorbs more sunlight. Extra absorption encourages further warming and melt. Feedback does not mean that change continues without limit; it means an initial change is amplified or reduced by a response inside the system.
How climate systems show up in forecasts, work, and hazards
Climate systems appear in decisions about crops, water, buildings, transport, public health, energy, insurance, and emergency planning. Specialists combine observations, physical models, and local exposure data to turn atmospheric processes into choices about timing, design, and risk.
Meteorologists read satellite images, radar, weather stations, balloons, buoys, aircraft reports, and numerical models. They look for pressure patterns, fronts, instability, moisture, and steering winds. A forecast is not a guess based on cloud appearance. It is a calculation of how physical fields evolve, checked against observations and adjusted for known model biases.
Farmers and agronomists match planting and irrigation to frost risk, soil moisture, heat accumulation, and seasonal rainfall. Water managers track snowpack, reservoir inflow, evaporation, drought, storage, demand, and allocation.
Architects and engineers use climate data to size drains, choose cooling systems, set wind loads, and limit overheating. Energy operators compare wind, sunlight, river flow, and demand. A still, cold winter evening can combine low wind generation with high heating demand, while a hot afternoon can strain electricity networks through cooling demand.
Public health teams use heat forecasts to plan warnings and services. Aviation staff consider thunderstorms, icing, visibility, jet streams, and crosswinds. Shipping routes depend on waves, winds, sea ice, and tropical cyclone forecasts. Insurers and emergency planners examine both the probability of a hazard and what lies in its path.
A hazard is not the same as a disaster. A powerful storm over an uninhabited ocean is a hazard. Disaster risk rises when people and assets are exposed and vulnerable, a relationship examined in how physical hazards become human disasters.
Climate attribution studies ask how human influence changed the probability or intensity of an event. Researchers compare large sets of model simulations representing a climate with observed human influence against simulations with that influence removed as far as evidence allows. The result is probabilistic. It does not claim that greenhouse gases created a storm from nothing; it estimates how the surrounding conditions and odds changed.
Four mistakes people make with climate patterns
Common errors come from mixing timescales, treating diagrams as literal machinery, confusing correlation with cause, or ignoring local geography. Correcting them requires checking the time period, identifying the physical mechanism, and separating the atmospheric hazard from its human consequences.
1. Treating one cold day as evidence against long-term warming
A local cold event and a rise in global average temperature can occur together. Weather moves heat unevenly, and a warming climate still contains winter, cold air masses, and natural variability. The valid test uses long records over a wide area, with consistent measurements and careful treatment of changes in instruments and station locations.
2. Assuming warm air can simply hold more water
The phrase is convenient but incomplete. Air does not act like a rigid container. At a higher temperature, the equilibrium vapour pressure is higher, so more water can remain as vapour before saturation is reached. Cooling air raises relative humidity if its vapour content stays similar, and condensation begins when saturation is reached.
3. Drawing permanent pressure belts around Earth
Textbook belts show long-term averages. In reality, the zone of tropical rainfall shifts with the seasons, continents interrupt ocean patterns, and storms move pressure systems day by day. Use the belts to explain broad climate regions, then add seasonal movement and local controls before predicting conditions at a particular place.
4. Calling every climate response a positive feedback
Positive means amplifying, not beneficial. Negative means reducing, not harmful. Ice loss that increases sunlight absorption is a positive feedback. A warmer surface emitting more infrared energy is a stabilizing response. Always state the initial change, the response it causes, and whether that response reinforces or opposes the initial change.
How latitude affects climate
Latitude controls the angle and seasonal duration of sunlight, setting a broad pattern of tropical warmth, middle-latitude seasonality, and polar cold. It does not determine climate alone, because altitude, ocean currents, prevailing winds, and distance from the sea can outweigh latitude locally.
Near the equator, day length and solar angle change relatively little through the year. Toward the poles, day length varies much more, including continuous daylight or darkness within the polar circles at certain seasons. The low solar angle also spreads energy over more ground and increases its path through the atmosphere.
Two cities on similar latitudes can still differ sharply. A west coast exposed to onshore ocean winds may have mild winters, while an inland location has larger seasonal swings. A high plateau can be cold within the tropics because air pressure decreases with height and rising air cools as it expands. Latitude is the first control to check, not the final answer.
How mountains create rain shadows
Mountains create rain shadows by forcing moist air to rise, expand, cool, and lose water on the windward side. The drier air then descends the leeward slope, compresses, warms, and develops lower relative humidity, producing a drier region behind the barrier.
The process begins only if wind carries air toward a slope. As unsaturated air rises, expansion cools it at about 9.8°C per kilometre under the dry adiabatic approximation. Once condensation begins, released latent heat slows the rate of cooling. The actual moist rate varies because it depends on temperature and water content.
Suppose air at a valley floor is 20°C and rises 1 kilometre before cloud forms. The dry approximation gives about 10°C at cloud base. Above that point it cools more slowly as condensation releases heat. After precipitation removes water, descending air warms by about 9.8°C per kilometre, so the leeward valley can be warmer and much drier than the windward side.
Rain shadows help explain dry basins and deserts beside mountain chains, but the height of the range, wind direction, moisture source, and storm paths all matter. Relief also controls river routes, settlement, transport, and visibility, topics connected through how landforms redirect air and water.
How El Niño changes weather far away
El Niño is the warm phase of a coupled tropical Pacific pattern in which weakened trade winds and shifted warm water alter tropical rainfall and atmospheric circulation. Those changes launch wave responses that can shift storm tracks and seasonal weather far beyond the Pacific.
Under typical tropical Pacific conditions, easterly trade winds push warm surface water westward. Cold, nutrient-rich water rises nearer the west coast of South America, and the western tropical Pacific supports deep convection. During El Niño, the trade winds weaken and warm surface water spreads eastward. Upwelling near South America is reduced, and the main region of rising, rain-producing air shifts.
The atmosphere responds to that relocated heating. Large pressure and wind patterns adjust, and the change can alter the position of jet streams. These teleconnections make some seasonal outcomes more likely in distant regions. They are not identical every event because El Niño’s location and strength vary, and other ocean and atmospheric patterns operate at the same time.
El Niño can shift the odds of wetter, drier, warmer, or cooler conditions in regions with a documented connection.
It cannot specify the weather on one future Tuesday or guarantee that every place follows its usual El Niño tendency.
Climate patterns make physical geography readable
Climate patterns connect Earth’s energy balance to rivers, soils, vegetation, ice, coastlines, and human settlement. Reading a place geographically means tracing the chain from sunlight and circulation through local terrain and water, then checking how people have adapted to the resulting opportunities and hazards.
A satellite image now offers a practical exercise. Find the brightest cloud bands and ask where air is rising. Locate clear subtropical zones and ask where air may be sinking. Notice how a mountain chain interrupts cloud cover, how snow changes surface brightness, and how a coastline creates temperature contrasts. Then compare the image with a pressure chart and a map of prevailing winds.
This habit turns memorized climate zones into testable explanations. It also links the topic to the wider study of physical and human geography, where spatial patterns matter because processes, environments, and decisions meet in particular places.
The takeaway: Start with uneven solar heating, follow the movement of air and water, add rotation and local geography, and keep weather timescales separate from climate timescales. That sequence explains more than any list of named climate regions.