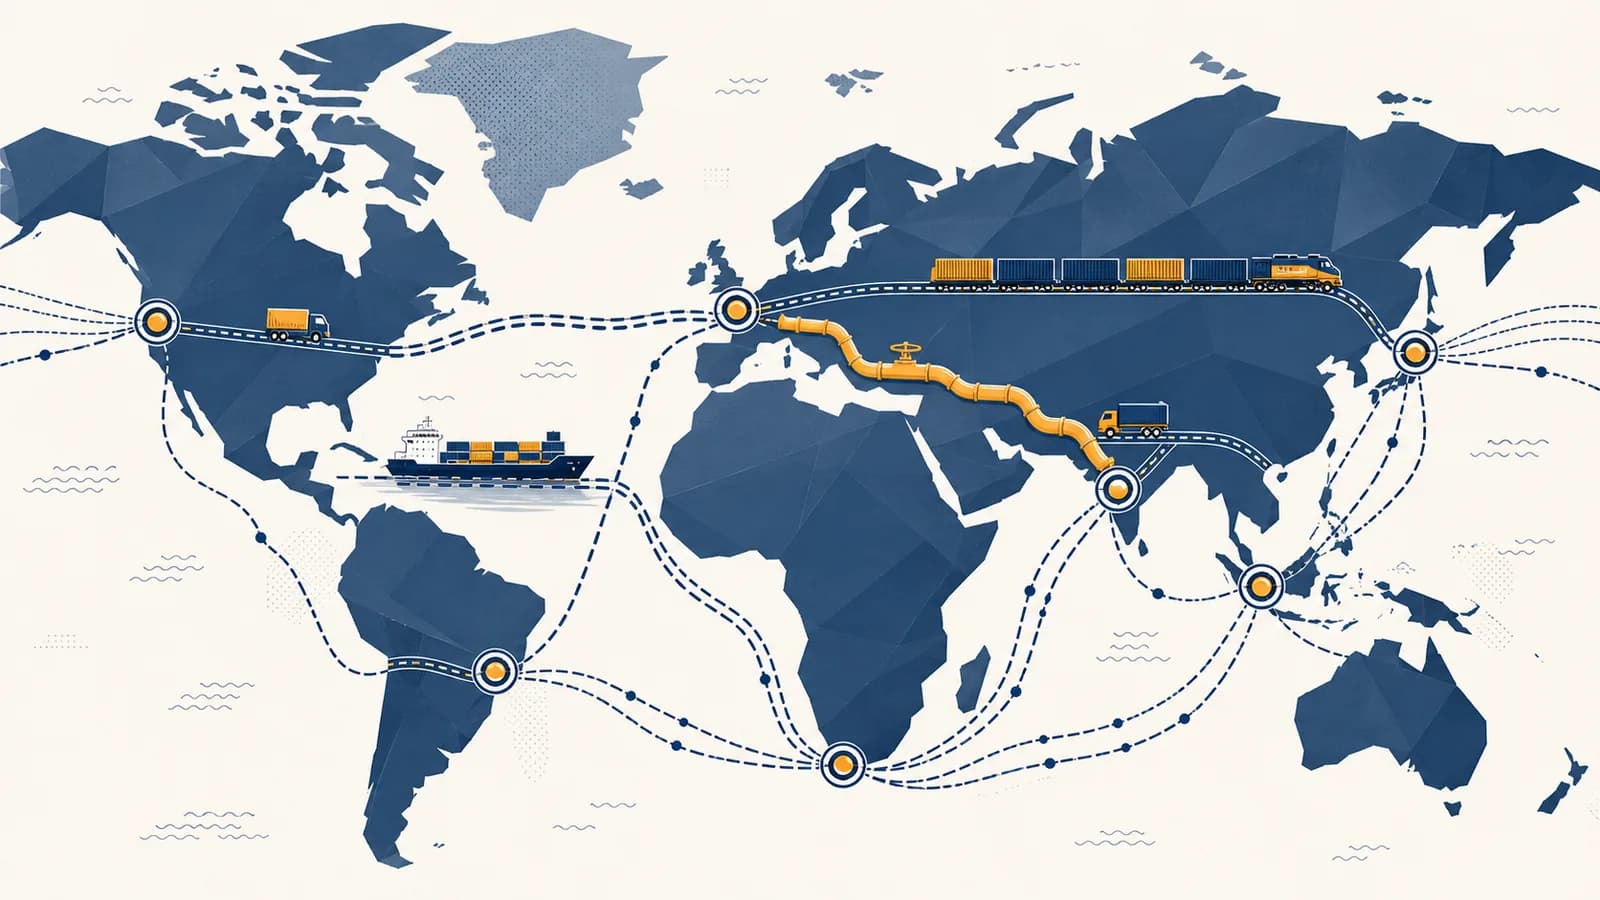
A trade route is a recurring path that moves goods, services, or valuable information between places, in the context of regional and global exchange. Global trade routes connect producers with buyers through shipping lanes, railways, roads, pipelines, air corridors, and digital cables. They exist because useful resources, skilled workers, factories, and customers are spread unevenly across Earth. A route is therefore more than a line on a map. It is a working system of vehicles, ports, border rules, storage sites, schedules, prices, and decisions.
What a trade route actually is
A trade route is a regularly used connection between an origin and a destination, supported by transport infrastructure and exchange. It may carry physical cargo, energy, money, or data, and it often joins several transport modes rather than using one road or sea lane.
The word route can suggest a fixed track, but most trade routes are better understood as corridors. A ship crossing the Atlantic can adjust its exact course for weather. Trucks may use different motorways when traffic changes. What stays recognizable is the chain of important places: the production area, transfer terminals, border crossings, distribution centres, and market.
Every working trade route has five basic elements:
- A traded item: grain, clothing, crude oil, machine parts, financial instructions, or another thing people value.
- An origin and destination: places with a supply and places with demand.
- A transport medium: ships, trains, lorries, aircraft, pipelines, cables, or a combination.
- Transfer points: ports, warehouses, rail terminals, airports, pumping stations, and data centres.
- Rules and organizations: customs agencies, carriers, insurers, port operators, banks, and trade agreements.
A route becomes important when repeated exchange makes supporting infrastructure worthwhile. A natural harbour attracts ships, then cranes and warehouses make the harbour faster to use, and frequent service attracts more cargo. This feedback can turn one port into a hub while a nearby coast with similar physical conditions handles little trade.
A line is not yet a route. A route exists when movement is repeated and supported by people, equipment, rules, and reliable transfer points.
How a shipment moves through a trade route
A shipment moves through a trade route by passing through linked stages of collection, long distance transport, border clearance, transfer, and delivery. Information and payment move alongside the cargo because each handler needs instructions, proof of ownership, and permission to continue.
A buyer orders a defined quantity from a seller. Their contract states the product, price, timing, and which party pays for each part of transport.
A local carrier moves the goods to a terminal. Packaging must protect the cargo and fit the next vehicle, such as a standard shipping container.
At a terminal, many smaller shipments are grouped onto a train, ship, aircraft, or long distance lorry. Consolidation spreads vehicle costs across more units.
Customs officers check declarations and may inspect cargo. Cranes, pumps, or loading equipment move the shipment between vehicles when the route changes mode.
A regional warehouse may split the large load into store orders. The final trip is often short in distance but expensive per unit because loads are smaller and stops are frequent.
Consider a container of bicycles assembled inland. A lorry takes it to a rail terminal, a train carries it to a port, and a crane loads it onto a container ship. At the destination port, the sequence reverses. The ocean crossing is only one link. A delay at the factory gate, railway, customs desk, or final warehouse can delay the whole shipment.
Documents follow a related route. A customs declaration identifies the goods and their value. A bill of lading records receipt of cargo and the transport agreement. Tracking messages report location and condition. If the paperwork names the wrong commodity or arrives late, a perfectly sound container can remain still.
How geography selects one route over another
Geography selects routes by changing distance, speed, capacity, risk, and construction cost. Seas permit heavy loads, flat land helps roads and railways, mountain passes funnel traffic, and borders add procedures. Firms compare the total result, not distance alone.
Physical geography sets possibilities. Navigable rivers can carry bulk cargo inland. Deep coastal water lets large ships approach a port without constant dredging. Deserts may be physically open yet demand reliable fuel, water, and maintenance. Mountain chains make tunnels and steep gradients expensive, so roads and railways often converge on a small number of passes.
Human geography decides which possibilities become busy corridors. A port needs connections to productive regions and large markets. A railway gauge must match, or cargo must be transferred at the break. Border opening hours, road quality, political relations, labour availability, and security can outweigh a modest difference in kilometres.
If goods cost 10,000 units, transport is 800, handling is 200, tariffs are 500, delay costs 100, and expected loss is 50, the landed cost is 11,650 units.
The expected loss term makes risk comparable with ordinary costs. Suppose route A costs 1,000 units and has a one in one hundred chance of a 20,000 unit loss. Its expected loss is units, giving an expected route cost of 1,200 units. Route B at 1,100 units with negligible loss is cheaper under these assumptions, although its quoted freight price is higher.
Time also changes value. Fresh berries, emergency medical supplies, and fashion items lose value if delayed, so they can justify air freight. Iron ore and coal are heavy relative to their unit value, so low cost sea or rail transport usually matters more than speed. Geography interacts with the product rather than imposing one best route for everything.
Trade routes versus supply chains
A trade route is the corridor used for movement between places, while a supply chain is the full network of organizations and activities that produces and delivers a product. One supply chain can use several routes, and one route can serve thousands of supply chains.
Focuses on spatial movement: origins, destinations, corridors, hubs, transport modes, borders, and chokepoints. The central question is how exchange gets across space.
Focuses on production and coordination: suppliers, factories, inventories, contracts, forecasts, retailers, and customers. The central question is how inputs become a delivered product.
A laptop supply chain might obtain minerals from one country, chips from another, and displays from a third before final assembly. Each input follows its own trade route. After assembly, finished laptops use further routes to regional warehouses and shops. Mapping how production networks connect suppliers and customers therefore requires more than drawing the final shipping lane.
A transport lane is narrower than a trade route. The traffic lane across one sea or the tracks on one railway are physical movement spaces. The trade route also includes access links, terminals, border processes, scheduled services, and the commercial reason for movement. A shipping company can change lanes because of weather without abandoning the wider route between two port regions.
A trade corridor is often a planned bundle of infrastructure along a broad axis. Governments may coordinate ports, roads, rail, power, and border posts within it. The term emphasizes development and policy. In ordinary use, however, trade route and trade corridor sometimes overlap, so a careful map should state what its lines represent.
How ports, hubs, and chokepoints organize traffic
Ports and hubs organize trade by combining cargo, transferring it between vehicles, and connecting many origins with many destinations. Chokepoints do the opposite spatially: they squeeze traffic through a narrow passage, making movement efficient but disruption unusually consequential.
A hub works like a sorting centre. Ten small ports do not each need a direct service to every distant market. Feeder ships can bring their containers to one large port, where the containers are transferred to long distance services. Airlines use a similar hub system for high value and time sensitive cargo. Rail terminals join inland production areas to coastal shipping.
A maritime chokepoint forms where land narrows the navigable choices. A strait joins larger bodies of water. A canal cuts across land to avoid a longer voyage. The Strait of Malacca, Strait of Hormuz, Suez Canal, and Panama Canal are familiar examples because they connect major trading regions and shorten routes. Their importance comes from network position, not simply from their width.
A carrier learns that a canal will be unavailable during its planned passage. It can wait, sail around a continent, transfer cargo to another mode, or cancel the service. Each option changes fuel use, arrival time, crew scheduling, port bookings, and the location of empty containers. Customers farther down the chain then decide whether to use inventory, pay for faster transport, or delay production.
The sea still imposes physical limits after a route is established. Water depth controls which vessels can enter. Winds, currents, reefs, seasonal ice, and storm exposure affect navigation and insurance. The study of how oceans, coasts, and seafloor conditions shape human activity explains why two coastal locations can have very different value as ports.
Pipelines create their own hubs and chokepoints. Compressor stations maintain gas pressure, pumping stations move liquids, and storage terminals balance flows. Unlike a ship, a pipeline cannot steer around a closure. Its low operating cost and steady capacity come with high construction cost and geographic rigidity.
This concentration produces both efficiency and dependence. A busy hub can support frequent departures, specialized repair services, and efficient cargo handling. Yet a strike, storm, cyberattack, accident, or conflict at that hub can affect places far beyond it. Network geography asks not only where traffic flows, but also how many practical alternatives exist.
How trade routes show up in prices and daily decisions
Trade routes show up in daily life through product price, availability, freshness, delivery time, and origin. Freight charges and delays enter business costs, while route capacity determines which goods can reach a place reliably and in usable condition.
The retail price of a shirt does not display a separate line for port congestion or warehouse rent, but those costs still exist. A seller can absorb them through lower profit, negotiate with suppliers, change the route, reduce other costs, or raise the final price. Competition and contracts decide how quickly a transport shock reaches the customer.
Route geography also shapes what seems ordinary in a shop. Refrigerated containers and rapid customs processes allow fruit, meat, and medicine to travel long distances under controlled temperatures. Bulk carriers make distant grain competitive in coastal markets. Poor rural roads can keep a farm economically remote even when its straight line distance to a city is small.
In this checkable example, a bakery has six days of imported ingredient stock, but its normal route has a ten day delay. The arithmetic leaves a four day gap: . The bakery can buy a substitute locally, pay for a faster route, change the recipe, reduce sales, or close temporarily. A map event has become a purchasing and production decision.
Food illustrates the connection clearly because time, temperature, and seasonal harvests matter at once. A region may grow enough calories overall yet still face local shortages if roads wash out, ports close, fuel becomes scarce, or household incomes fall. The guide to how access, supply, and stability determine who can obtain food follows those links beyond transport alone.
Jobs that work directly with trade routes
Freight planners compare services and book capacity. Port operators schedule berths and cranes. Customs brokers prepare declarations. Train dispatchers allocate track space, while warehouse managers time arrivals against storage capacity. Cartographers and geographic information system analysts map corridors, hazards, and customer locations.
Public sector work is equally direct. Transport planners forecast traffic and compare infrastructure projects. Customs agencies enforce trade rules. Coast guards support safe navigation. Diplomats negotiate access and standards. Emergency managers identify which communities depend on a bridge, port, fuel terminal, or single road.
How organizations respond when a route breaks
Organizations respond to a broken route by detecting the disruption, measuring which shipments and customers are exposed, and choosing among waiting, rerouting, substituting, or reducing demand. The best response depends on duration, cargo urgency, spare capacity, and the cost of alternatives.
Detection comes first because a late shipment and a lost shipment require different decisions. Carriers use location reports, port notices, weather forecasts, and messages from drivers or crews. Buyers compare those reports with purchase orders and inventory records. A map of the incident is useful only when connected to actual cargo and deadlines.
Rerouting is possible only if another path has the right infrastructure and spare capacity. A road cannot replace a high capacity railway without enough lorries, drivers, fuel, border processing, and loading space. Another port may be geographically close yet have cranes of the wrong type or no scheduled connection to the destination.
Inventory buys time. A factory holding twelve days of a component can tolerate a seven day delay without stopping, assuming normal use and no other interruption. The buffer is days. Holding more stock reduces some disruption risk but ties up money and requires storage, security, and sometimes refrigeration.
Substitution changes the traded item or supplier rather than the route. A manufacturer may qualify a second component source. A power station may be designed for more than one fuel grade. Such flexibility takes advance testing and contracts. It cannot always be invented after a closure starts.
A detour on a map is not automatically a usable alternative. Capacity, vehicle type, border permission, cargo handling, safety, and commercial service must all work together.
Governments respond on a larger scale by repairing infrastructure, changing border procedures, coordinating emergency access, protecting navigation, or supporting alternative corridors. Their decisions can shift traffic between regions for years because firms build warehouses and supplier relationships around whatever routes prove dependable.
What historical trade routes changed
Historical trade routes changed settlement, political power, language, religion, technology, diets, and disease patterns by creating repeated contact between distant populations. Their effects spread beyond merchants because roads, ports, caravan cities, and naval power reorganized entire regions around exchange.
The Silk Roads were a changing network of overland and maritime connections across Eurasia, not one continuous road used end to end by most merchants. Goods often changed hands many times. Silk travelled westward, while horses, metals, glassware, religious ideas, artistic styles, and technical knowledge moved in several directions.
Indian Ocean trade used seasonal monsoon winds. Sailors could plan outward and return voyages around predictable changes in wind direction. Ports in East Africa, the Arabian Peninsula, South Asia, and Southeast Asia became exchange centres because they linked regional products and onward routes. Knowledge of weather was part of the infrastructure.
Merchants combine short route segments, with oasis towns and ports serving as transfer and market centres.
The voyage becomes part of sustained Atlantic contact, conquest, forced migration, biological exchange, and colonial trade.
The canal creates a direct water connection between the Mediterranean and Red Sea, shortening many Europe to Asia voyages.
The canal lets ships cross the Central American isthmus without sailing around South America.
Standard boxes gradually reduce repeated handling and make transfers among ships, trains, and lorries faster.
Atlantic routes after 1492 cannot be described as simple voluntary commerce. European empires seized land, extracted resources, and transported millions of enslaved Africans through the transatlantic slave trade. Route maps therefore show systems of power as well as movement. Asking who controlled ships, ports, labour, and law changes the historical explanation.
Containerization changed modern route mechanics because one sealed box could transfer between a lorry, train, and ship without unloading its contents at every terminal. The gains depended on standard dimensions, compatible cranes, reorganized ports, and inland road and rail connections. Technology altered which ports prospered and which waterfront jobs remained.
How digital trade still depends on physical geography
Digital trade moves services and information electronically, but it still depends on physical routes made of fibre optic cables, landing stations, data centres, electricity networks, and local connections. Distance, capacity, regulation, and concentrated infrastructure continue to shape speed, cost, and risk.
An online design file can cross an ocean without a ship, yet the data usually travels through submarine fibre optic cables resting on or buried beneath the seabed. Those cables reach land at specific stations and connect to terrestrial networks. Cable routes avoid some hazards while accepting others, including earthquakes, anchors, fishing activity, and politically sensitive waters.
Latency is the time a signal takes to travel and be processed. Light in fibre travels more slowly than light in a vacuum, and indirect routing adds distance. Financial trading, live communication, remote control, and online games can be sensitive to small delays, so direct cable connections and nearby computing facilities have economic value.
Moves matter through vehicles and terminals. Capacity may be measured in containers, tonnes, barrels, or vehicle slots. Weather and handling time strongly affect movement.
Moves encoded information through cables and network equipment. Capacity is measured as data flow. Electricity, equipment failure, cable damage, and access rules affect movement.
Services also cross borders through people. A consultant may deliver work through a video call, an engineer may travel by air to inspect equipment, and a repair requires spare parts on a physical route. Calling an activity digital does not remove its material foundations.
How climate and politics can redraw routes
Climate and politics redraw trade routes by changing physical access, operating risk, legal permission, and expected cost. A route may become seasonally unusable, face new border controls, or lose traffic when firms judge another corridor more dependable.
Climate affects both sudden events and long term planning. Floods can damage roads and rail foundations. Drought can lower river levels and restrict vessel loads. Heat can deform surfaces and reduce some equipment performance. Stronger protective works may keep a corridor open, but construction and maintenance costs then become part of the route decision.
Melting sea ice can lengthen navigable seasons in some Arctic waters, yet reduced ice does not create an ordinary open ocean. Seasonal darkness, moving ice, sparse rescue infrastructure, limited ports, difficult weather, environmental harm, and insurance remain important. A shorter geometric line may still be a poor commercial route.
Politics can alter access overnight through war, sanctions, customs changes, strikes, territorial disputes, or new trade agreements. Energy routes are especially visible because pipelines and tanker passages connect fixed resource regions with large consuming markets. The geography of fuels, state power, and energy dependence shows why control over corridors can influence diplomacy and security.
A government compares two railway alignments. The shorter line crosses steep terrain and a disputed border. The longer line follows a river valley within friendly territory but reaches fewer towns. Engineers estimate construction and maintenance, economists estimate traffic, environmental specialists assess habitat and water effects, and diplomats assess cross border reliability. No single map layer supplies the answer.
Route changes also create winners and losers within countries. A new bypass may lower national transport costs while reducing passing trade in an older town. A larger port can create logistics work but increase noise, land pressure, and lorry traffic nearby. Geographic scale matters: a benefit at the national level can impose a local cost.
Four mistakes people make with trade routes
Most errors about trade routes come from treating map lines as complete explanations. Distance matters, but so do cargo type, transfer points, capacity, rules, time, risk, and power. A sound analysis checks the full movement system and the people affected by it.
1. Assuming the shortest route is cheapest
The shortest path may cross mountains, congested borders, shallow water, or high fee infrastructure. A longer sea route can carry much larger loads with fewer transfers. Compare landed cost and reliability, then ask how the answer changes for perishable, bulky, dangerous, or high value cargo.
2. Treating every map line as equally important
A schematic map can make a weekly feeder service look like a major daily corridor. Line width, traffic volume, service frequency, cargo value, and direction may all matter. Read the legend, date, unit, and data source before comparing routes. If these are absent, the map supports only limited conclusions.
3. Explaining trade with physical geography alone
A good harbour does not create trade by itself. It needs inland connections, investment, labour, security, legal access, and customers. Colonial history and state policy can explain why infrastructure exists in one location. Physical and human geography work together, and their relative weight can change over time.
4. Assuming disruption affects everyone equally
A large retailer may book scarce freight capacity or use several suppliers, while a small business may have one contract and little inventory. Consumers with more income can absorb a price rise more easily. Workers at a closed terminal face a different impact from firms that gain traffic on the alternative route.
The takeaway: Trace the item, the vehicles, the transfer points, the rules, and the alternatives. Then calculate who pays when time, capacity, or access changes.
Trade routes make geographic relationships visible
Trade routes make geography visible because they connect environmental conditions, settlement, infrastructure, politics, and economic choice on the same map. Reading them well means explaining why movement follows one corridor, how the system operates, and who benefits or bears risk.
To analyse a route, choose an ordinary object and read its label. Identify where its main material came from, where it was processed, which transport modes could connect those places, and which borders or chokepoints lie between them. Then test an interruption: close one terminal or add three days. Which alternative is physically possible, and who must decide?
This method turns a map into an explanation. It also connects trade with cities, climate, oceans, resources, migration, development, and political boundaries. The wider collection of geography explanations and applications gives those relationships more context. Once you notice the route inside a product, a port report, or a price change, global exchange becomes something you can trace rather than a distant abstraction.