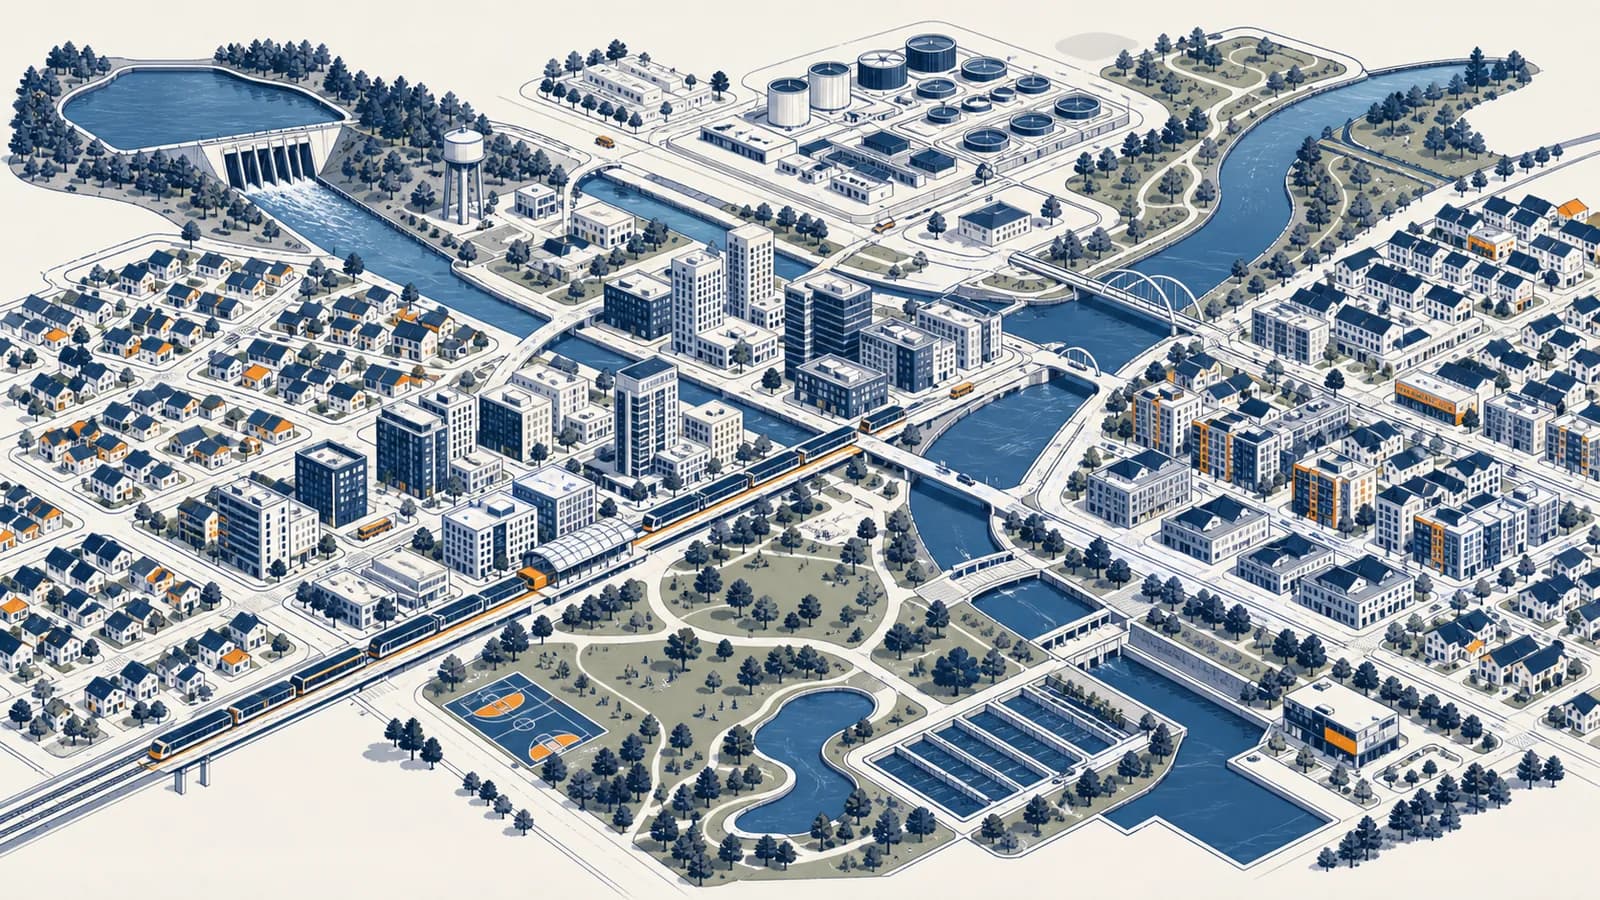
Urban planning is a public decision-making process that organizes land use, transport, housing, public space, and infrastructure, in the context of growing and changing settlements. This urban planning definition also covers the everyday tools people search for as city planning, zoning, land use planning, and transport planning. The process exists because choices about one parcel or street affect many other people: a new housing block changes travel demand, water use, school enrollment, shade, noise, and land prices. Planning makes those connected effects visible before public money is spent or construction begins.
What urban planning actually is
Urban planning is the coordinated work of deciding what may be built, where networks and public services should go, and how places should change over time. It combines geographic evidence, design, law, engineering, public finance, and political choice.
A plan is not simply a drawing of an attractive city. It is a set of linked decisions. A land use map might reserve space for homes, shops, industry, parks, and flood storage. A transport plan might set a street hierarchy and identify future bus routes. Development rules might control building height, setbacks, access, or how much floor space can occupy a site. A capital program then says which public projects will be funded first.
The word urban does not restrict planning to large city centers. Planners work in suburbs, small towns, metropolitan edges, and networks of settlements. They also study the rural land and natural systems that support an urban area, including farms, watersheds, quarries, reservoirs, ports, and energy corridors. A municipal boundary rarely contains the whole system that residents depend on.
A plan joins space to time. A map shows where change is intended, while policies, budgets, and construction stages show when and how that change can occur.
Urban planning therefore works at several scales. A site plan may arrange one development. A neighborhood plan may connect housing to schools and local streets. A citywide plan may allocate growth and major infrastructure. A regional plan may coordinate several local governments around commuting, water, freight, or ecological systems. The questions are related, but the evidence and authority differ at each scale.
How the planning process works
The planning process turns a public problem into an adopted course of action through evidence, goals, alternatives, evaluation, consultation, legal approval, investment, and review. Each stage narrows choices, but later evidence can send a proposal back for revision.
Planners state what decision is needed and draw the study boundary. A housing shortage, unsafe crossing, congested freight route, and flood exposure are different problems, even if they occur on the same map.
They map parcels, buildings, population, jobs, travel, services, hazards, land ownership, and existing legal rights. Field observation tests whether official data match conditions on the ground.
Goals might include more homes near frequent transit or safer access to schools. Constraints include budgets, protected habitats, steep slopes, infrastructure capacity, and rights established by law.
Each option must be plausible. One may concentrate growth near stations, another may spread it among several centers, and a third may combine limited expansion with redevelopment.
Planners estimate travel, costs, housing capacity, emissions, service demand, displacement risk, and exposure to hazards. Distribution matters: an average benefit can hide a serious burden on one neighborhood.
Residents, landowners, businesses, public agencies, and community groups test assumptions and reveal missing knowledge. Consultation informs a decision; it does not turn every incompatible request into policy.
The responsible authority approves the plan or rule. Budgets, permits, land purchase, infrastructure contracts, and partnerships then convert it into physical change.
Indicators show whether the policy produced its intended result. If rents rise faster than incomes, buses remain slow, or flood damage continues, the response needs adjustment.
The order looks neat on paper, but planning is iterative. A drainage study can remove a proposed development area. Community evidence can reveal that a mapped footpath is inaccessible. A cost estimate can force a project into stages. Good planning records these revisions so the final choice can be traced back to evidence.
This loop explains why a plan can be useful even when no map is followed exactly. Its purpose is to make assumptions, priorities, and consequences explicit, then create a basis for coordinated decisions as conditions change.
Land use planning versus zoning
Land use planning sets a direction for how an area should develop, while zoning turns part of that direction into legally enforceable rules for individual land parcels. A plan guides decisions; a zoning code controls what an owner may build.
A policy document and map might propose mixed housing and shops around a station, protect a river corridor, and identify a future school site. Its horizon often extends beyond one construction project.
A legal rule might permit apartments and shops on a particular parcel, limit height, require a building line, or prohibit an industrial use that would conflict with nearby homes.
The distinction matters when people read a colored planning map. A color does not always grant immediate permission to build. A project may also need subdivision approval, building approval, environmental review, road access, utility capacity, or a separate change to the zoning map. The exact names and powers vary by legal system.
Zoning is also only one implementation tool. Governments can buy land, build streets, fund transit, levy development charges, protect historic buildings, offer tax incentives, require affordable units, or negotiate infrastructure through development approval. Public investment often shapes development as strongly as regulation does.
A planner therefore asks two separate questions: Is this development allowed? and What conditions make it likely? Confusing those questions leads to plans that permit growth on paper but never supply the infrastructure, finance, or assembled land needed to produce it.
How planners measure density, access, and demand
Planners measure density to describe how much activity occupies an area, access to show which opportunities people can reach, and demand to estimate how people may use land or services. No single measure describes urban performance by itself.
Density always needs a numerator and a denominator. Population density divides residents by land area. Employment density does the same for jobs. Residential density may count dwellings per hectare. Building intensity often uses floor area ratio, which compares total building floor space with site area.
A building with 6,000 square metres of floor area on a 2,000 square metre site has .
The same ratio can produce different forms. A low building covering most of a site and a taller building covering less of it may have equal floor area. Setbacks, courtyards, street width, entrances, and ground floor uses change how either form feels and functions. Density is a quantity, not a complete design.
Access is richer than distance. A hospital may be close in a straight line but hard to reach because a railway blocks the route. A job may be far away but accessible by a frequent direct train. Planners use walking networks, travel times, service frequency, cost, slopes, crossing safety, and step-free routes to estimate practical access.
These invented audit values illustrate why one number is insufficient. A planner would compare the route with alternatives, check crossing delays, observe conditions at different times, and separate results for people with different mobility needs. A circle drawn around a clinic cannot show those barriers.
Demand estimates need similar care. Past traffic counts show observed trips under past prices, routes, and land uses. They do not reveal every trip people would make under a different network. A safe cycle route, a new fare, or homes closer to work can change behavior. Forecasts are conditional statements based on assumptions, not photographs of the future.
How urban planning shows up in a daily trip
Urban planning shapes a daily trip through the location of destinations, the connections between streets, the space assigned to each travel mode, and the timing of development. A route reflects years of land decisions, standards, budgets, and maintenance.
A student lives one kilometre from school. The direct street ends at a fenced rail line, so walking requires a long detour. Cars have a bridge, but the footpath does not. The problem is not straight-line distance. It is a missing network connection created by earlier infrastructure choices.
A planner could map where students live, trace actual walking routes, count crossings, observe traffic speeds, identify land ownership, and compare bridge or underpass sites. Engineers would test structure and drainage. The school would report arrival patterns. Residents could identify places that feel unsafe. The final intervention might be a crossing, but finding the right crossing is a geographic problem first.
Street design also allocates scarce width. A wider traffic lane, protected cycle lane, bus platform, tree strip, loading bay, and footpath can all compete for the same space. The choice affects travel time, delivery access, heat, stormwater, and injury risk. There is rarely a design that maximizes every outcome.
Mode share provides one way to observe the result. Suppose a count records 1,000 morning trips: 450 by car, 250 by bus, 180 on foot, and 120 by bicycle. Because the total is shown, each percentage can be checked directly.
The count describes that place and time, not a universal preference. Weather, school schedules, fuel prices, bus reliability, parking supply, disability access, and the available routes all influence the result. Planners repeat counts and connect them to land use before claiming that a policy caused a change.
How urban planning shows up in housing and public space
Urban planning affects housing and public space by deciding where homes can be added, what building forms are permitted, which services must accompany growth, and how streets, parks, and civic places are distributed among neighborhoods.
Housing capacity begins with land and rules, but it does not end there. A parcel may permit apartments yet lack sewer capacity. A site may be connected to utilities but priced too high for the intended project. Construction may be legal but delayed by fragmented ownership. Planning can remove some constraints, while finance, building costs, household incomes, and the behavior of owners remain important.
Location changes the meaning of a housing unit. A lower rent at the urban edge may be offset by longer trips and the cost of running a car. A smaller home near jobs and frequent transit may offer better access but less private space. Planners compare the combined housing and transport burden because a boundary on a land use map cannot capture a household budget.
Public space includes streets, squares, parks, playgrounds, waterfront paths, and small planted areas. Ownership is not the only issue. A privately owned plaza may allow public passage under agreed conditions, while a public park can still be difficult to reach. Useful analysis asks who can enter, at what times, by which routes, for which activities, and under what rules.
| Planning question | Evidence to examine | Possible action |
|---|---|---|
| Can more homes fit here? | Parcel dimensions, permitted floor area, infrastructure capacity, hazards, and project feasibility | Change rules, upgrade utilities, assemble sites, or choose another location |
| Can residents reach daily needs? | Travel time to food, schools, health care, jobs, and transit by different modes | Add a connection, service, crossing, route, or mixed use area |
| Is public space fairly distributed? | Location, size, quality, opening hours, shade, safety, accessibility, and population served | Improve an existing place, acquire land, or redesign a street |
Growth can also displace people. New infrastructure may raise land values and rents near the improvement. Preventing harm may require tenant protections, public or nonprofit housing, phased construction support for local businesses, or land reserved before prices rise. The available tools depend on local law, but the distributional question is universal: who receives the benefit, and who carries the cost?
Urban food access also connects city form to regional systems. A market needs customers, delivery access, storage, and suppliers beyond the city. The guide to how geography shapes reliable access to food follows those connections across production, distribution, affordability, and risk.
How urban planning works with climate risk and infrastructure
Urban planning reduces climate and infrastructure risk by keeping vulnerable uses away from hazards, protecting natural systems, directing growth toward serviceable land, and coordinating buildings with transport, water, drainage, energy, waste, and emergency access.
Risk depends on more than the hazard itself. Floodwater becomes a disaster where exposed people and assets are vulnerable. A flood map may identify depth or probability, while planning adds the locations of homes, hospitals, substations, roads, and evacuation routes. The same depth can have very different consequences on a wetland and in a basement apartment.
This is a conceptual relation, not a universal calculator. Reducing any factor can reduce risk, but each factor must be defined for the decision being made.
A city can lower exposure by avoiding new development in a flood path. It can lower vulnerability by elevating equipment, improving warnings, or adapting buildings. It can sometimes reduce the hazard locally by restoring space for water, although an intervention may shift water elsewhere. Catchment geography matters because runoff crosses property and municipal boundaries.
Heat has a different pattern. Dark surfaces absorb solar energy, buildings can restrict airflow, and a lack of vegetation removes shade and cooling through evapotranspiration. Planners can map surface temperature alongside tree cover, building form, age, health, housing conditions, and access to cool public places. The priority is not always the hottest pixel. It may be the hot neighborhood with the least ability to adapt.
Infrastructure creates long commitments. A water main or rail line can last through several development cycles and encourage building around it. Growth staged too far ahead of networks can leave residents with poor services and force expensive extensions. Growth blocked where networks have capacity can push demand toward less efficient locations.
Administrative borders do not stop flows. Water, smoke, traffic, commuters, freight, and electricity cross them, so a local plan can transfer costs to a neighboring area unless governments coordinate.
That coordination extends far beyond the street network. Cities rely on fuel, minerals, water, and construction materials whose extraction can create distant disputes. The page on how control of land and resources produces conflict explains why an urban project can have consequences at its source as well as its destination.
Energy choices also shape land. Power stations, transmission corridors, fuel terminals, charging networks, and building standards each occupy space and distribute costs differently. Urban energy security cannot be studied only within city limits because supply networks connect distant territories to local buildings and transport.
Four mistakes people make with urban planning
Four common mistakes are treating a plan as a prediction, assuming density has one physical form, measuring access by distance alone, and judging a project only by its citywide average. Each mistake hides uncertainty, design choices, or unequal effects.
1. A plan is treated as a prediction
A plan is a chosen direction under stated assumptions, not a claim that every mapped project will occur. Population, finance, politics, technology, and hazards can change. Scenario planning tests several plausible conditions so decisions remain useful even when one forecast is wrong.
The practical test is to find the plan's dependencies. If a new district assumes a bridge, water plant, and major employer, those items need funding, authority, and timing. A colored area without an implementation path is an intention, not an outcome.
2. Density is assumed to mean high-rise towers
Density measures an amount per area, while building type describes form. Terraced houses, courtyard apartments, mid-rise blocks, and towers can produce overlapping density ranges depending on unit size, site coverage, streets, and open space.
Comparisons must also use the same boundary. Net residential density may count only housing land. Gross density may include streets, parks, schools, and other uses. Quoting one beside the other without definitions creates a false contrast.
3. A nearby service is assumed to be accessible
Proximity is straight-line nearness; accessibility is the ability to reach and use something. A river, motorway, fare, staircase, unsafe crossing, limited opening time, or lack of capacity can turn a nearby service into an unavailable one.
Network analysis and field observation correct the map. Planners trace actual routes and record barriers. They may also examine whether the destination has space, is affordable, and serves the relevant language or mobility needs.
4. An average benefit is assumed to benefit everyone
A project can reduce average travel time while increasing it for a smaller group. A park can raise neighborhood amenity while adding rent pressure. A drainage channel can protect one district while moving water faster toward another.
Distributional analysis separates effects by place and population. It maps gains, losses, timing, and uncertainty. This does not make every conflict disappear. It makes the conflict visible enough for mitigation, compensation, redesign, or an honest political choice.
The sentence is a summary, not an attributed quotation. It supplies a useful test for any proposal: inspect not only the total result, but also where each effect lands and who can respond to it.
How do urban plans become law and built projects?
Urban plans become effective through formal adoption, detailed regulation, permits, budgets, land agreements, and construction. The responsible institutions must have legal authority and money, while affected people usually receive notice and opportunities to comment or challenge decisions.
The exact route varies across countries and municipalities. A representative council may adopt a strategic plan. A planning board or agency may apply detailed rules. Courts or appeal bodies may review whether procedures and powers were used lawfully. Infrastructure agencies may control transport or water investment outside the planning department.
Implementation has two broad sides. Regulatory action tells landowners what is permitted, prohibited, or conditional. Capital action spends money or land on streets, schools, parks, utilities, and public housing. A plan that changes only one side can fail. Permission for homes does little where sewer capacity is absent; a new station may attract too little development where rules prevent enough activity nearby.
A town marks a station area for mixed use. It then changes parcel rules, designs safer crossings, schedules a water upgrade, buys land for a square, issues building permits, and monitors housing completion and ridership. The adopted map was one step in a chain of public and private actions.
Public participation fits throughout that chain. Early participation can help define the problem and alternatives. Later hearings may focus on whether a specific rule or permit meets legal tests. These are different tasks. Asking for broad visions only after design and funding are fixed offers less influence than asking while alternatives remain open.
Can a city grow without spreading outward?
A city can absorb some growth within its existing footprint through infill, reuse, subdivision, and taller or more compact buildings, but the feasible amount depends on land, infrastructure, hazards, market conditions, public acceptance, and the quality of redevelopment.
Infill places new development on vacant or underused sites among existing buildings. Adaptive reuse gives an existing building a new function. Redevelopment replaces or substantially changes a site. Each can use existing networks more efficiently, but each can also strain schools, drainage, parks, or transit if service capacity is not expanded.
Outward expansion is often called sprawl when it is dispersed, separated by use, and difficult to serve without long car trips. Not every edge development has those features. A connected extension with mixed uses, staged infrastructure, and protected ecological land differs from isolated subdivisions that leap over undeveloped parcels.
The choice is therefore not a slogan about growth boundaries. Planners compare the amount and type of demand, available sites, infrastructure cost, travel effects, ecological value, hazard exposure, and displacement risk. A compact strategy that removes low-income residents to distant areas can relocate sprawl rather than solve it.
Metropolitan economies also depend on goods moving through warehouses, ports, terminals, factories, and shops. The guide to how products move through global supply networks explains why freight land and last-mile access belong in plans alongside housing and passenger travel.
A city rarely chooses one growth pattern forever. It may combine infill around transit, reuse of commercial sites, additions to existing homes, and carefully located extensions. Monitoring shows which sites actually deliver housing and whether public services keep pace.
Urban planning makes geography visible in ordinary decisions
Urban planning is applied geography because it connects location, scale, movement, environment, and human inequality to decisions about land. It turns spatial patterns into choices that can be debated, funded, built, measured, and changed.
Outside a classroom, a person meets planning in a rent notice, a building application posted on a fence, a delayed bus, a shaded footpath, a flood insurance question, a new school boundary, or a public meeting about a park. Each event has a location, a governing rule, a network of effects, and people with different power to respond.
To read a place like a planner, choose one proposed development or street change and ask five concrete questions. What is allowed now? What evidence defines the problem? Which networks will the change use? Who gains or loses access? Which agency has the power and budget to act? Then visit the site and test the map against the ground.
The takeaway: Urban planning is not a finished picture of an ideal city. It is a repeatable way to connect evidence about places with public choices, legal tools, investment, and measured results.
Those questions also connect the topic to the wider study of places, people, environments, and spatial change. Notice the next blocked path, empty site, crowded stop, or flood channel you pass. Its shape is evidence of earlier decisions, and its alternatives can be studied.