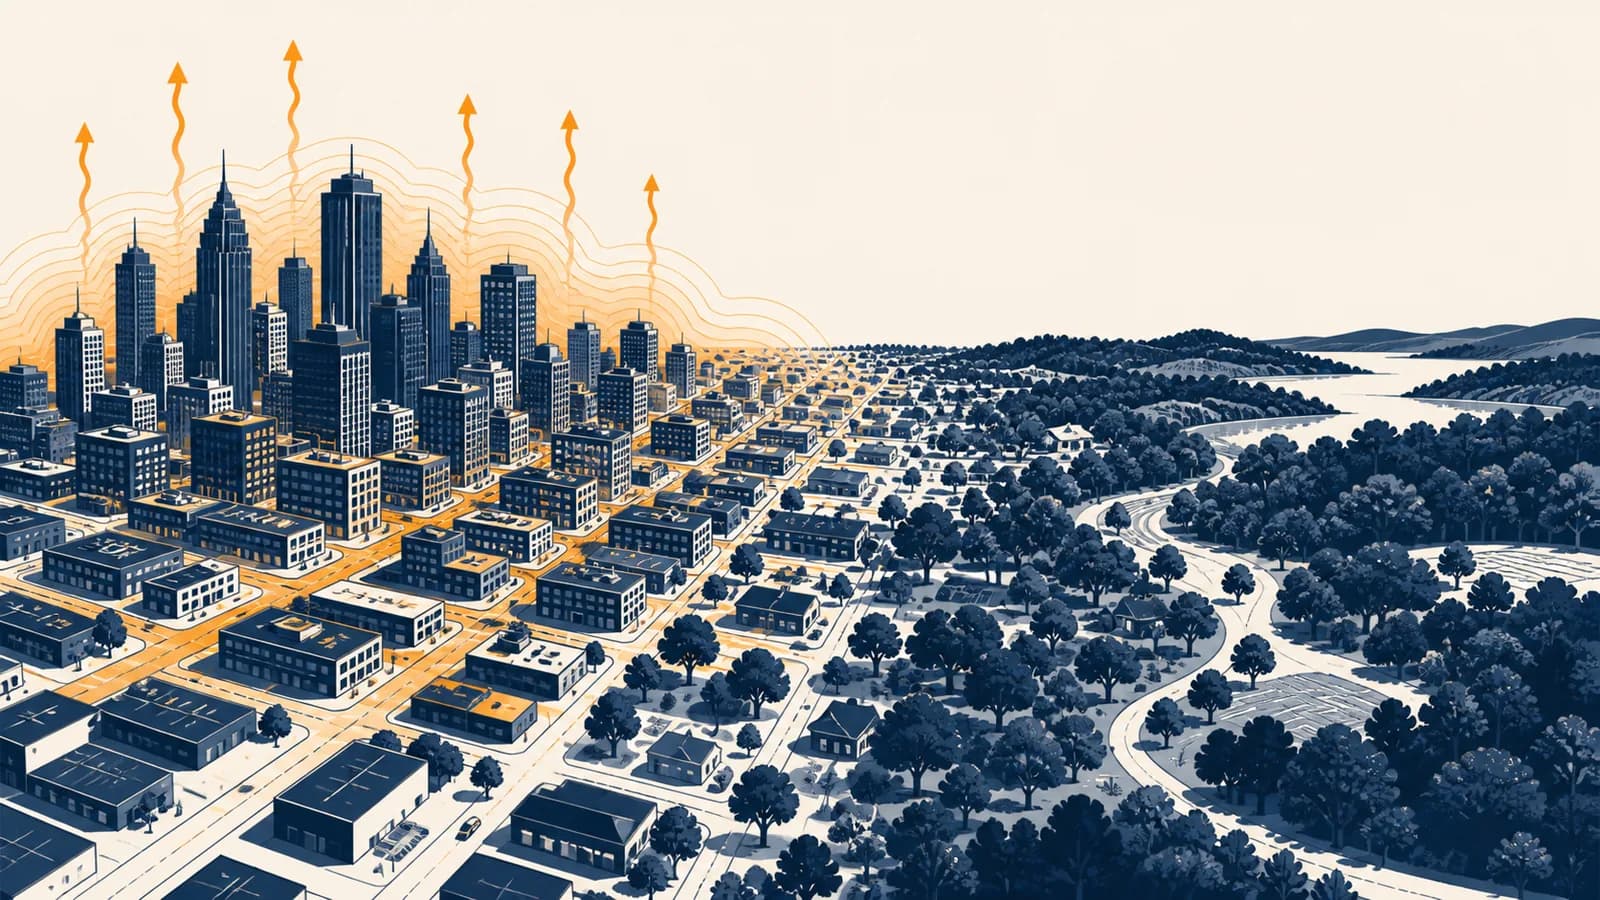
An urban heat island is a local climate pattern that makes a built-up area warmer than nearby rural land, in the context of urban geography and weather. The urban heat island effect exists because cities replace moist soil and plants with dark, dry materials that store solar energy, while buildings, vehicles and machines add heat. Search terms such as city heat, urban temperature, hot pavements and heat island causes all describe parts of the same process. The pattern matters because where heat collects affects health, energy use, street design and daily decisions about shade.
What an urban heat island actually is
An urban heat island is a measured temperature difference between a built-up place and a less developed reference area nearby. It is an area-wide pattern, not a literal island, and its size changes with time, weather, land cover and the temperatures being compared.
A city does not have one temperature. A tree-lined riverside, an asphalt car park, a shaded courtyard and an exposed roof can all record different values at the same moment. The term urban heat island describes the broader tendency for the built environment to be warmer, especially when its readings are compared with rural land outside it.
A fixed patch of heat with a clear shoreline around it.
A shifting temperature pattern with warm centres, cooler pockets and boundaries that move as wind, cloud and human activity change.
The comparison area matters. A weather station in an irrigated field may be cooler than dry natural scrub even before a city is considered. A station on a hill may be cooler because of elevation. Good comparisons therefore use several sites and account for terrain, distance from the coast, vegetation and the instruments themselves.
Heat islands are one example of how people alter physical processes through land use. The wider set of links between atmosphere, settlements and resources appears across how physical and human processes fit together across geography.
How the urban heat island effect works
The effect develops when a city gains, stores or produces more heat than it can release. Dark surfaces absorb sunlight, dry surfaces lose little energy through evaporation, street canyons slow heat loss, and human activity supplies additional warmth.
Every surface has an energy budget. Incoming sunlight may be reflected, used to evaporate water, transferred to the air, or stored in the ground and buildings. Changing a field into roads and buildings changes the share going into each route.
Reflection comes first. Pale surfaces send a larger share of short-wave solar radiation back upward than dark surfaces. The reflected share is called albedo. A dark roof usually absorbs more solar energy than a pale roof receiving the same sunlight, although age, dirt, moisture and the angle of the Sun also affect the result.
Evaporation changes the route. Plants draw water from soil and release water vapour through leaves. Evaporation and transpiration require energy, so some incoming energy becomes latent heat carried in water vapour instead of immediately raising surface temperature. Sealed ground blocks that route. Rain runs into drains, the surface dries, and more energy is available to warm the material and nearby air.
Storage delays the heat. Concrete, brick and asphalt can absorb energy through the day and conduct it inward. After sunset, the stored energy moves back toward cooler surfaces and air. Rural vegetation often cools sooner, so the urban to rural temperature difference commonly becomes clearer in the evening or at night under calm, clear conditions.
Buildings alter radiation and wind. In a narrow street, walls see other walls instead of a wide open sky. Long-wave radiation leaving one surface can be absorbed by another. Buildings also create shelter, turbulence and channels for wind. Less ventilation can slow the removal of warm air, while a well-aligned street may funnel a breeze and cool faster.
People add heat. Vehicle engines, industrial equipment, cooking, lighting, data centres, human bodies and air-conditioning systems all release energy. An air conditioner cools an indoor space by moving heat outdoors and using electricity, so its outdoor unit warms the surrounding air even while the room becomes safer or more comfortable.
A city does not manufacture all of its heat. Much of the effect comes from redirecting solar energy: less reflection and evaporation, more storage, and slower release after sunset.
How the surface energy balance explains the temperature
The surface energy balance accounts for incoming energy by dividing it among reflection, heating the air, evaporating water and storage. Urban development raises temperature when it shifts energy away from evaporation or reflection and toward sensible heat, storage and human heat emissions.
Net radiation plus human-made heat equals sensible heating of air, latent heating through evaporation, and change in stored heat.
Here, is net radiation after incoming and outgoing radiation are combined. is heat released by fuel and electricity use. is sensible heat that changes air temperature. is latent heat associated with water changing phase. is the change in energy stored in materials, soil and other parts of the surface.
The equation is an accounting rule, not a promise that every term is easy to measure. Heat can also be carried sideways by wind or water, and real studies may add terms for that transport. The simplified version still exposes the central mechanism: if less energy goes into , more must leave through another route or accumulate in storage.
Imagine two equal plots receiving the same 100 units of net energy over an hour. On a damp planted plot, 50 units power evaporation, 30 warm the air and 20 enter storage. On a dry paved plot, only 5 units power evaporation, while 55 warm the air and 40 enter storage. Both budgets total 100. The values are invented for arithmetic, but the energy shift is the real mechanism.
This worked budget also explains why watering can cool a surface only while water is available. Once the water has evaporated, the latent heat route shrinks again. It also explains why a material that stays relatively cool at noon might release stored energy later. Noon surface temperature alone cannot reveal the whole daily budget.
Surface heat islands versus atmospheric heat islands
A surface heat island is a pattern of hot roofs, roads and ground, while an atmospheric heat island is a pattern in air temperature. The two are related but not interchangeable because surfaces respond quickly to sunlight and air mixes across a larger volume.
Surface temperature records what a material is doing
Surface temperature is the temperature of the outer skin seen by a sensor. A sunlit metal roof can heat rapidly, while a shaded wall nearby remains much cooler. Thermal satellite instruments infer this temperature from emitted infrared radiation, producing a broad map of warm and cool surfaces.
Air temperature records the layer people breathe
Air temperature is measured with a shielded thermometer that allows airflow while protecting the sensor from direct solar radiation and rain. A thermometer left in full sun may be heated by radiation and report the sensor's temperature rather than a representative air temperature.
| Question | Surface heat island | Atmospheric heat island |
|---|---|---|
| What is measured? | Temperature of roofs, roads, soil, leaves and water surfaces | Temperature of air near the ground or through the urban atmosphere |
| Common instrument | Thermal satellite, aircraft sensor or infrared radiometer | Shielded weather station, mobile sensor or balloon instrument |
| Strong response | Direct sunshine, shade and surface moisture | Mixing, wind, stored heat and heat transfer from surfaces |
| What it helps answer | Which materials and blocks are hottest? | What thermal conditions do people and ecosystems experience? |
A thermal image taken in the afternoon may make a treeless industrial roof look extreme, while a night-time air survey may show the densest centre retaining the most warmth. Neither map automatically disproves the other. They represent different variables, hours and spatial scales.
How materials, plants and city shape control heat
Urban form controls heat through surface colour, moisture, thermal properties, building geometry and airflow. No single feature decides the outcome: a reflective roof can reduce solar absorption, while shade trees reduce radiation and supply cooling when enough water supports transpiration.
Colour changes absorption, but colour is not the whole material
Albedo measures the fraction of incoming short-wave radiation that a surface reflects. In its simplest form, it is a ratio between zero and one.
If a test surface reflects 30 of 100 measured energy units, its albedo is .
A high albedo reduces the share of sunlight absorbed at that surface. Yet a full assessment also considers glare, durability, dirt, winter conditions and where reflected radiation travels. A bright wall can send radiation toward a pedestrian or another building. Design works at street scale, not by colour alone.
Thermal properties decide how fast energy moves and stays
Heat capacity describes how much energy a material needs for a temperature change. Conductivity describes how readily heat passes through it. A thick urban structure can take energy into its mass by day and return it after sunset. The same storage that limits a rapid daytime temperature rise can prolong night-time warmth.
Plants cool through shade and water loss
A tree canopy intercepts direct sunlight before it reaches a person, wall or pavement. Leaves also transpire water when biological and weather conditions allow. These are distinct benefits: shade can reduce radiant heat immediately, while evapotranspiration changes the neighbourhood energy budget.
Planting choices involve climate and maintenance. A tree without enough soil volume or water may fail to build a useful canopy. Roots need space, and species must suit local heat, rainfall and pests. The connection between urban planting and habitat is explored through how concentrated areas of biological value are identified and protected.
Street geometry controls sky exposure and ventilation
Tall buildings can shade a street during part of the day, but they can also reduce the fraction of open sky visible from the ground. This sky view affects long-wave heat loss at night. The same buildings alter wind direction and speed. A useful design therefore considers season, latitude, street orientation and prevailing winds together.
How urban heat islands are measured
Researchers measure an urban heat island by comparing matched temperature observations across space and time. Reliable studies define the temperature variable, reference site, instrument height, land cover, weather conditions and sampling period before reporting an urban to rural difference.
Choose surface or air temperature, day or night, and the spatial scale. A street design study and a regional climate study require different observations.
Include urban types such as dense blocks, low-rise housing and parks, plus reference sites whose elevation and regional weather are reasonably comparable.
Use calibrated sensors with consistent shielding, height, timing and data checks so an equipment difference is not mistaken for a climate pattern.
Document cloud, wind, recent rain, season, surface cover and nearby heat sources. These conditions help explain why the measured intensity changes.
Calculate simultaneous differences, inspect repeated observations and show uncertainty rather than treating one hot afternoon as a permanent city value.
A basic intensity calculation subtracts a rural reference temperature from an urban temperature at the same time.
If a shielded urban station reads and a matched rural station reads , the worked difference is .
The subtraction is easy; choosing defensible inputs is harder. If the rural station sits beside irrigated grass while the urban station sits above a car park, the result combines urbanisation with two very specific land covers. A network of sites or repeated mobile transects can reveal how much the answer depends on location.
Satellite observations give consistent coverage across a city, but cloud can block a thermal view and overpass time fixes the hour observed. Fixed stations give a time series at a few points. Sensors mounted on cars or bicycles reveal street-level contrasts, although changing speed, shade and traffic require careful control. Models can join these sources and test scenarios, but their output is only as sound as their assumptions and input data.
Temperature needs a label. A claim about “city temperature” is incomplete unless it identifies surface or air, location, height, time and comparison area.
How urban heat shows up in health, homes and work
Urban heat becomes a practical problem when warmer surroundings increase heat exposure, slow night-time recovery, raise cooling demand or make outdoor tasks unsafe. The burden is uneven because shade, housing quality, health, income and access to cooling differ between people and neighbourhoods.
Human heat strain depends on more than air temperature. Humidity affects sweat evaporation. Sunlight adds radiant heat. Wind changes convective and evaporative cooling. Clothing, workload, hydration, age, health and acclimatisation change how a person responds. A shaded thermometer reading therefore cannot describe every exposure on a sunny pavement.
A delivery worker crosses an unshaded loading yard in the afternoon, then carries boxes into a poorly ventilated upper-floor room. The yard adds solar and surface radiation; the work adds metabolic heat; the room may retain energy after sunset. Useful controls include shade, water, rest, scheduling, ventilation and a cooler recovery space.
Homes behave differently too. A top-floor flat beneath a dark roof may receive sustained heat through the ceiling. A dwelling with cross-ventilation may release heat when outdoor air becomes cooler, while a single-aspect flat may trap it. Opening windows is not always the right action: it depends on whether outdoor air is cooler, air quality is acceptable and security allows it.
Electric cooling can protect health, but it also changes the urban system. High demand strains electricity networks, power generation may release pollution or greenhouse gases, and outdoor condenser units reject indoor heat. The geographic questions of supply, demand and infrastructure connect to where energy systems are located and who they serve.
Heat risk often follows earlier planning decisions. Districts with mature trees, insulated homes and accessible green space may remain more tolerable than districts dominated by wide roads, bare yards and low-quality housing. Mapping vulnerability therefore combines physical exposure with social information, without assuming that every person inside a mapped area has the same needs.
The distinction guides action. A hot warehouse roof may be a strong target for reflective treatment even when few people occupy it. A slightly cooler bus stop may deserve priority because many people wait there without shade. Temperature is evidence, not the entire decision.
How cities can reduce heat without shifting the problem
Cities reduce heat by increasing shade and evapotranspiration, reflecting more solar energy, releasing stored heat, improving airflow and cutting waste heat. Effective plans match each measure to local climate, water, buildings and users, then check for side effects elsewhere.
Trees and planted ground need space and water
Canopy shade can protect streets, playgrounds, walls and windows. Planted soil also absorbs rain and supports evapotranspiration. The design question is where a canopy will survive and whom it will shade at the hours of greatest exposure. Maintenance, roots, visibility, allergies and drought restrictions belong in the plan from the start.
Cool roofs work on the building envelope
A roof with high solar reflectance absorbs less short-wave energy. Thermal emittance affects how readily it releases long-wave radiation. Benefits vary with insulation, roof area, climate, building use and season. A roof measure cannot by itself shade the pavement or solve indoor overheating caused by unshaded windows.
Shade structures provide targeted protection
A canopy over a bus stop or school yard can reduce direct solar exposure without waiting for a tree to mature. Its angle, height and material determine where the shade falls. Designers must also consider reflected radiation, rain, lighting, access and wind loading.
Water can cool, but supply and humidity set limits
Ponds, fountains, wet surfaces and irrigation use energy through evaporation. In a water-scarce place, potable water used for cooling may create a larger resource problem. In humid air, evaporation is less effective. Recycled water, stormwater storage and carefully targeted irrigation may improve the balance where local rules and water quality allow.
Passive design reduces both exposure and waste heat
External shading, insulation, suitable glazing, ventilation and building orientation can keep indoor conditions safer with less mechanical cooling. Efficient equipment then removes remaining heat with less electricity. Urban heat policy and building energy policy work best when treated as connected systems.
Choosing among these measures is a sustainability problem because a local benefit can use land, water, materials or energy elsewhere. The broader method appears in how environmental, social and economic trade-offs are tested over time.
The takeaway: The best intervention is not a universal object called a heat solution. It is a measured change to a specific energy pathway, in a specific place, for people who can actually use its benefit.
Four mistakes people make with urban heat islands
Four common mistakes are treating the effect as constant, confusing surface and air readings, blaming only concrete, and assuming any green feature guarantees cooling. Each mistake removes a variable that must stay visible for evidence and design to remain useful.
1. Treating one temperature difference as a permanent city score
Urban heat island intensity varies by hour, season, cloud, wind, soil moisture and the locations compared. A reported difference is an observation under stated conditions. It should not be copied into another city, another night or another measurement type as if it were a fixed property.
2. Reading a thermal map as a map of the air people breathe
Bright colours on a satellite image usually represent land surface temperature classes. They can identify hot roofs and bare ground, but they do not directly provide shaded near-surface air temperature or personal heat strain. The legend, units, overpass time and variable name are part of the evidence.
3. Saying concrete alone causes the effect
Material matters, but so do colour, moisture, geometry, vegetation, wind and human heat. Concrete in permanent shade behaves differently from dark asphalt under direct sun. A planted district can still overheat during dry weather if irrigation stops and buildings block night-time heat loss.
4. Counting green features instead of measuring performance
A tiny decorative lawn, a mature shade tree and a shallow green roof do not deliver the same service. Performance depends on canopy area, location, water, soil, species, roof design and the hour of use. Monitoring survival and temperature after installation tests whether a plan worked.
“This neighbourhood has a park, so it is protected from urban heat.”
“At stated hours and weather conditions, shaded routes and nearby homes are cooler than matched unshaded locations, and residents can reach the space.”
Do urban heat islands disappear in winter, rain or wind?
Urban heat islands do not simply switch off outside summer, but their strength and consequences change. Rain increases surface moisture, wind mixes air, cloud alters radiation and winter reduces solar input, so any of these conditions can weaken, move or occasionally reshape the pattern.
Wind can replace warm local air with air from elsewhere and mix temperature differences vertically. Yet buildings also shelter some streets and channel flow through others. A regional breeze may therefore weaken the city-wide contrast while leaving a poorly ventilated courtyard warm.
Rain cools surfaces through evaporation and increases the energy later available for latent heat. The effect lasts only while water remains and depends on drainage, soil and weather. Sealed surfaces can shed water quickly, whereas planted ground may hold it for later use.
In winter, lower solar input changes the daytime budget, but heating systems add waste heat and buildings still store energy. A warmer urban area can sometimes reduce heating demand or frost exposure, while also disrupting ecological cues. The label “heat island” describes a temperature contrast, not an automatic judgment that every consequence is harmful in every season.
Calm, clear conditions often reveal the contrast most clearly. Strong wind promotes mixing, while cloud changes both incoming sunlight and night-time loss of long-wave radiation.
Can a small town or a single park create a heat pattern?
A small settlement can produce an urban heat island if its surfaces and energy use differ enough from its surroundings. A park can produce a local cool island, but its reach depends on canopy, moisture, size, wind and the form of nearby streets.
“Urban” describes land use and built form, not a minimum population threshold in the physics. A compact town surrounded by moist vegetation may show a detectable contrast. A sprawling settlement in dry terrain may show a different pattern because the rural reference is already hot and dry.
Within a city, parks, rivers, irrigated grounds and shaded streets can form cooler patches. Cool air may move beyond a park boundary, especially under favourable wind and topography, but there is no universal distance. A tree canopy directly over a walking route gives a more dependable personal benefit than hoping distant cool air will arrive.
Does climate change cause the urban heat island effect?
Climate change and the urban heat island effect are different processes that can act together. Greenhouse gases alter the wider climate, while urban form creates local temperature contrasts; a hotter regional baseline can make the same local heat addition more dangerous.
The heat island can exist without climate change because it follows from local energy exchanges. Climate change can occur over oceans and rural areas where there is no city. During a regional heat event, however, warm background air, hot urban surfaces and reduced night-time cooling can overlap. That combined exposure is what residents experience.
Local heat measures cannot replace cuts in greenhouse gas emissions, and emission cuts do not remove the need for shade, safer buildings and heat plans. The policies operate at different scales and times. Some actions can assist both: efficient buildings reduce waste heat locally and can lower energy demand, depending on how the electricity is produced.
A local contrast linked to land cover, urban form, moisture and human heat emissions.
A long-term shift in the climate system, now driven mainly by human greenhouse gas emissions.
A city heat map makes geography visible
Urban heat islands show geography as a relationship among atmosphere, land cover, infrastructure and inequality. Reading that relationship well means checking the variable and scale, tracing the energy pathways, and asking which people can reach shade, cooling and safer buildings.
The next hot day offers a field observation. Compare a shaded planted edge with an exposed paved space at similar times. Notice direct sunlight, wind, moisture, building height and the surfaces facing the sky. Do not use touch as a precise thermometer, and do not touch surfaces that may burn. The aim is to predict which energy routes differ, then look for measurements that could test the prediction.
A planner can use the same reasoning at block scale. First locate exposure with surface and air observations. Then locate vulnerability and daily activity. Finally, choose an intervention tied to a mechanism, such as shade for radiant exposure, insulation for indoor heat flow or trees for shade and evapotranspiration. After construction, measure again under comparable conditions.
This is environmental geography in working form. A street material changes an energy budget; that budget changes temperatures; those temperatures meet housing, work and public space. The useful habit is to keep the chain intact, because a coloured map becomes meaningful only when it leads back to physical processes and forward to a decision.