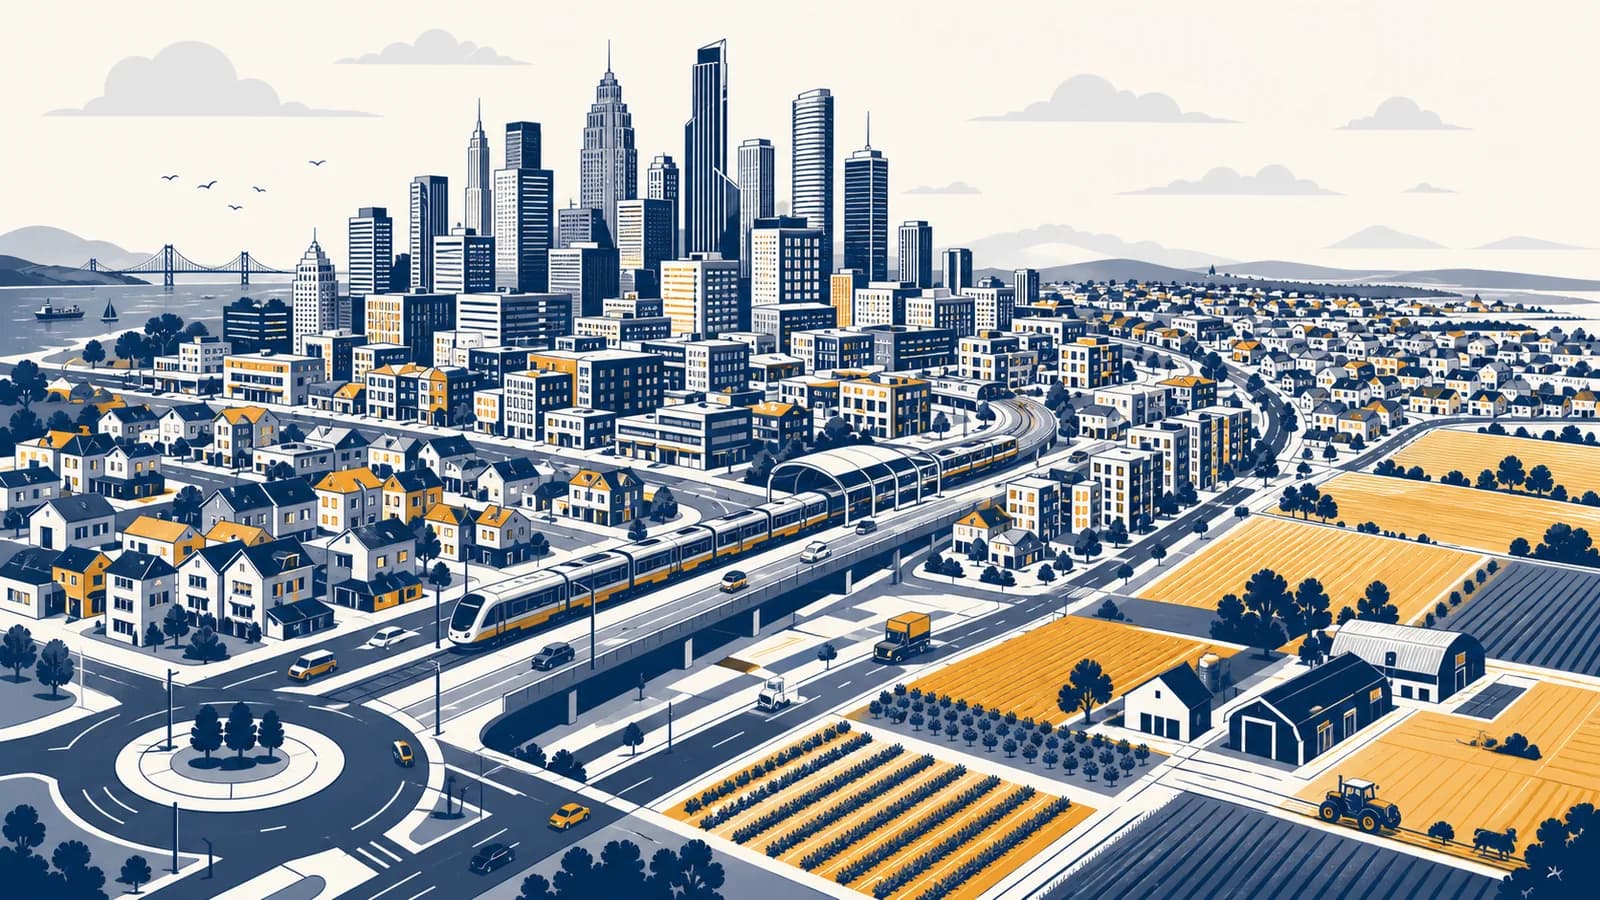
Urbanization is a population and land-use process that increases the share of people living in towns and cities, in the context of human geography. A clear urbanization definition must distinguish this change from simple city growth. The causes of urbanization include migration, natural population increase, changing jobs, and the reclassification of settlements. Its effects appear in housing, transport, public services, land prices, ecosystems, and political power. The process exists because people and organizations gain advantages by concentrating workers, customers, knowledge, and infrastructure in connected places.
What urbanization actually is
Urbanization is an increase in the urban share of a population, usually accompanied by changes in settlement size, density, employment, and built land. It describes a shift in how a society is distributed and organized, not simply the existence of cities.
Imagine a country with 10 million people. Four million live in places that the national statistics office classifies as urban, so the country is 40 percent urban. Ten years later, 5.4 million of 12 million people live in urban places. The urban population has grown, and the urban share has risen to 45 percent. Both urban growth and urbanization have occurred.
The word urban needs care. There is no single worldwide population cutoff that turns a settlement into a town or city. National definitions may use population size, density, administrative status, the share of workers in non-farm jobs, access to services, or a combination. A settlement can therefore be counted as urban under one national method and rural under another.
Urbanization is a change in proportion. If urban and rural populations grow at the same percentage rate, the urban share stays constant, so urbanization has not occurred even though cities contain more people.
Urbanization also changes relationships between places. Food, water, energy, labor, money, and waste cross the urban boundary every day. A city depends on farms, reservoirs, power networks, ports, and distant supply chains. The topic therefore includes the wider urban system, not only streets and buildings inside a municipal line.
How urbanization works
Urbanization works when urban populations grow faster than rural populations through rural to urban migration, natural increase, or boundary reclassification. Jobs, services, transport, land markets, and government decisions shape where growth occurs and who gains access to the resulting city.
Households consider work, education, safety, family ties, housing costs, and services. Firms consider workers, customers, suppliers, transport, land, and regulation.
Some people migrate into urban settlements. Births also add residents, and deaths remove them. The balance of these movements changes the urban population.
Homes, roads, water pipes, electricity networks, schools, clinics, and workplaces are built, extended, subdivided, or used more intensively.
A dense village may be officially reclassified as a town. An existing city may grow upward, fill vacant land, or spread into nearby rural districts.
A larger labor market can attract employers, while congestion and high rents can push residents and firms toward cheaper edges or other cities.
This process is cumulative. A hospital attracts patients and skilled workers. Their spending supports shops and services. Better transport can expand the area from which workers commute. Yet the same concentration raises competition for central land and can overload infrastructure. Urbanization does not follow one smooth path because each feedback can strengthen growth, redirect it, or exclude people.
Historical context matters. Industrial production often encouraged rapid concentration because factories needed many workers near machines, power, railways, and ports. Service economies can still favor cities because finance, government, medicine, media, and specialist business services benefit from frequent contact and large pools of skill. Digital communication changes some location choices, but servers, homes, offices, transport, and workers still occupy physical places.
Urbanization versus urban growth
Urban growth means that the number of urban residents increases, while urbanization means that the urban percentage of the total population increases. A country can experience urban growth without urbanization if its rural population grows at the same rate or faster.
Ask, “How many more people live in urban places?” This is an absolute change in the urban population.
Ask, “Has the urban share of the whole population risen?” This is a relative change in national or regional settlement.
Consider two periods in the same imaginary country. In Period A, the urban population rises from 4 million to 5 million while the total rises from 10 million to 11 million. The urban share rises from 40 percent to about 45.5 percent, so urbanization occurs. In Period B, the urban population rises from 5 million to 6 million while the total rises from 11 million to 14 million. Urban growth continues, but the urban share falls to about 42.9 percent, so the country experiences relative de-urbanization during that period.
Urbanization is also different from urban expansion. Expansion refers to built-up land spreading outward. A city can add residents through taller buildings and smaller households without spreading much. It can also spread over a large area while population grows slowly, especially where low-density housing, wide roads, parking, and separated land uses consume land.
| Measure | Question answered | Possible unit |
|---|---|---|
| Urban population | How many people live in urban settlements? | People |
| Urban share | What percentage of all residents is urban? | Percent |
| Built-up area | How much land is covered by urban structures? | Square kilometres |
| Urban density | How concentrated are residents within an area? | People per square kilometre |
Keeping these measures separate prevents false conclusions. Satellite images may show rapid land conversion, a census may show modest population growth, and household data may show rising crowding in particular districts. All three observations can be true because they describe different dimensions of urban change.
How migration and natural increase change the urban share
Migration changes the urban share when people move between settlement types, while natural increase changes it through births minus deaths within urban populations. Reclassification adds a third route when a growing rural settlement is officially counted as urban without residents moving house.
Rural to urban migration is selective. Young adults often have more reason and ability to move for study or work than children or older adults. A migrant may first stay with relatives, rent a room near a transport route, then move again as work and income change. These linked decisions connect urbanization to how migration reshapes populations and places.
Geographers often organize migration pressures as push factors and pull factors, but the labels do not make a move automatic. A crop failure may push a household to seek another income. A factory, college, hospital, or relative may pull one member toward a city. Transport cost, housing rules, discrimination, caregiving duties, and information can block the move. People make decisions with limited options, not from a perfect list of every destination.
A family farm can support two workers, but four adult children need incomes. One moves to a regional city where a cousin knows of an apprenticeship. The migrant sends money home, then helps a sibling find a room and a job. One household decision becomes a migration network that lowers the cost and risk of later moves.
Natural increase can become the largest source of urban population growth even where migration began the concentration. A city with many young adults may record many births because a large share of residents is in childbearing ages. This is demographic momentum. It does not prove that birth rates are unusually high, and it cannot be measured by counting new arrivals alone.
Reclassification is less visible but important. Suppose a settlement crosses the national threshold for population and density, or a city boundary expands around nearby communities. The official urban population rises even if no one has moved that day. Researchers comparing censuses must check whether definitions and boundaries stayed constant.
How agglomeration makes cities productive and expensive
Agglomeration is the concentration of people and economic activity that lets workers, firms, suppliers, and ideas connect at lower cost. The same concentration also produces higher land prices, congestion, pollution, and competition for services, so urban advantage has limits.
Shared suppliers reduce operating costs
Dense markets can support specialist services that a single firm could not maintain alone. A cluster of garment producers may sustain fabric wholesalers, machine repair shops, freight companies, designers, and training centers. Each producer gains access without owning the whole supply chain. This is one reason industries often form districts rather than appearing at evenly spaced points.
Large labor markets improve matching
A large city may contain many employers seeking similar skills and many workers seeking related jobs. A worker who loses one position has more possible employers within reach. A firm can recruit for a narrow specialty. The benefit depends on usable transport and fair access, since a job across the city is not truly available if the trip is unaffordable or takes several hours.
Proximity helps knowledge move
Some knowledge can be written in a manual. Other knowledge moves through observation, trust, practice, and quick conversation. Universities, laboratories, manufacturers, hospitals, investors, and public agencies may benefit from being near one another. These relationships help explain why specialized industries cluster in particular places.
Congestion costs rise with concentration
More activity increases demand for scarce central land and limited network capacity. Rents rise where access is valuable. Roads slow when too many vehicles use them at once. Water, drainage, schools, and clinics become strained when investment lags behind population. A city remains attractive only if its benefits exceed these costs for the household or firm making the decision.
This distribution is not neutral. A new rail station can make nearby land more useful and expensive. Owners may gain through higher property values, while renters may face higher rents or displacement. Planners therefore ask not only how much benefit an investment creates, but also who can reach it and who pays for the change.
How urban form changes land, distance, and daily life
Urban form is the physical arrangement of streets, plots, buildings, activities, and open space. It turns population concentration into daily travel patterns, housing choices, service costs, and environmental effects, with density and connectivity shaping how far people must move.
A compact, mixed-use district places homes near shops, schools, and workplaces. A low-density, single-use district separates them. Density alone does not settle the result: a dense area with disconnected streets can still force long routes, while a moderately dense area around reliable transit can offer good access.
City growth usually combines three spatial processes. Infill builds on vacant or lightly used parcels inside the existing urban footprint. Vertical growth adds floor space through taller buildings. Peripheral expansion converts land at the edge. Each responds to land prices, planning rules, construction costs, infrastructure, and demand.
The density in this worked example is people per square kilometre. That average does not mean every square kilometre contains 4,000 residents. A lake may contain none, an industrial zone few, and an apartment district many more. The chosen boundary strongly affects the result.
Urban form also records earlier decisions. A street built for carts may become a bus corridor. A former railway yard may become housing. A floodplain occupied when a settlement was small may later contain thousands of homes. Comparing these forms with the reasons settlements take particular shapes helps explain why apparently similar cities work differently.
How urbanization is measured
Urbanization is measured by dividing the population classified as urban by the total population and tracking the result through time. Sound measurement also checks the urban definition, geographic boundary, census date, data quality, and causes of change.
Worked example: .
To measure the pace of urbanization, compare urban shares, not just urban headcounts. If the share rises from 60 percent to 66 percent over ten years, the change is 6 percentage points. It is also a 10 percent relative increase in the share because . Percentage points and percent change answer different questions.
Census data count people by usual residence, but censuses occur at intervals and can miss mobile or informally housed residents. Household surveys provide detail but cover samples. Administrative records capture service users but may exclude those without documents. Satellite images map built surfaces but cannot by themselves show how many people live there or how residents earn a living.
Good analysis combines sources. A satellite image may reveal new roofs at the edge. Census tables can show population and household size. Travel surveys can identify the functional city. Building permits reveal formal construction, while field observation may find subdivisions absent from official maps. Disagreement between sources is evidence to investigate, not a reason to select the most convenient figure.
Check the denominator and the boundary. “The city grew by 8 percent” is incomplete unless it states what grew, over what dates, and inside which geographic area.
A map can mislead even when every number is correct. Large administrative areas attract visual attention, although a small, dense district may hold more residents. Choropleth maps should normally show rates or shares, while proportional symbols can represent counts. The map legend, classification method, and boundary date are part of the claim.
How urbanization shows up in housing, work, and public services
Urbanization appears in daily life through housing construction, changing occupations, crowded transport, rising land values, and new demands on water, sanitation, schools, health care, and waste collection. Access depends on income, location, legal status, infrastructure, and public policy.
Housing supply can lag behind household demand
Population is not the same as the number of households. If 120,000 residents live in households averaging four people, they require about 30,000 dwellings. If average household size falls to three with population unchanged, they require about 40,000 dwellings. That is 10,000 additional homes without population growth. Vacancy, demolition, second homes, and overcrowding complicate the calculation, but the mechanism is clear.
Formal housing production may be too slow, too costly, or located far from work. Residents then adapt by sharing rooms, adding structures to plots, renting subdivided units, or building in settlements without secure tenure. Calling all such areas chaotic hides the systems residents create for credit, transport, water purchase, childcare, and local government. It also hides unequal exposure to eviction, fire, flooding, and unsafe construction.
Employment shifts do not guarantee secure work
Urbanization often accompanies a declining share of workers in agriculture and a rising share in manufacturing or services. Yet location does not guarantee a formal contract, stable hours, or high pay. Street vending, repair work, domestic service, construction, delivery, and home-based production can connect formal firms and household survival.
Infrastructure is a network, not a single object
A tap provides safe water only if a source, treatment plant, pumps, pipes, electricity, maintenance staff, testing, drainage, and payment system keep working. Extending a pipe to a new district may require greater network capacity upstream. Similar dependencies apply to sewers, electricity, transit, and digital service.
A city can afford either a distant housing project with cheap land or fewer homes near existing jobs and pipes. The distant site lowers the land bill but may require new roads, longer utility lines, and high household travel costs. The budget must count the connected system, not only the building price.
These choices link urbanization with how development decisions affect rural and urban communities. A reservoir serving the city may restrict land use upstream. A new market can give nearby farmers more buyers. Urban demand can therefore change rural livelihoods even while the rural population remains in place.
How urbanization changes environmental risk
Urbanization changes environmental risk by concentrating people and assets, replacing permeable ground, increasing resource demand, and altering exposure to heat, pollution, floods, and hazards. Planning and infrastructure determine whether concentration reduces risk through shared services or multiplies it.
Rain falling on soil can infiltrate, evaporate, or move slowly across vegetation. Roofs and pavement reduce infiltration and send water quickly toward drains and low ground. If development increases runoff faster than drainage capacity, flood depth and speed can rise. Building in a floodplain adds exposure even if the rainfall pattern remains unchanged.
Urban heat has several causes. Dark surfaces absorb solar energy. Concrete and brick store heat and release it later. Closely spaced buildings can reduce airflow. Vehicles, air conditioners, and industry release waste heat. Trees cool through shade and evapotranspiration, so unequal tree cover can produce unequal heat exposure within the same city.
Density can also reduce some environmental costs. Apartments share walls and may require less energy per household for heating or cooling than detached homes in the same climate. Frequent transit can carry more people with less road space than private cars. Shorter trips can make walking practical. These benefits depend on building quality, electricity sources, service reliability, and actual travel behavior.
A potentially damaging event or process, such as a flood, heatwave, earthquake, or toxic release.
The possible harm created when a hazard meets exposed people and assets with limited capacity to anticipate, cope, and recover.
A hazard does not distribute harm evenly. Outdoor workers face heat for longer. Basement homes flood before upper floors. Residents without insurance or savings recover more slowly. Emergency planning must therefore map vulnerability and access, not only the physical hazard.
Four mistakes people make with urbanization
Four common errors are treating urbanization as simple city growth, assuming all migration is permanent, reading national averages as local experience, and judging the process as automatically good or bad. Each error removes a mechanism needed to explain real urban change.
1. Calling every increase in city population urbanization
A city's population can rise while the national urban share stays level or falls. Calculate the share using total population, then compare dates. Also check if the place boundary expanded, because annexation can increase the recorded population without physical movement.
2. Assuming migrants make one permanent rural to city move
People may move seasonally, circulate between several homes, commute weekly, return after losing work, or keep strong economic ties to a village. A survey that asks only for usual residence can miss these flows. Movement is better represented as a network than a one-way arrow.
3. Treating the national average as a description of every city
A national urban share combines capital cities, industrial centers, small towns, and peripheral settlements. One city may lose residents while another expands rapidly. Within a growing city, a central district may shrink as households move outward. Scale changes the pattern.
4. Declaring urbanization either a problem or a solution
Concentration can make hospitals, pipes, transit, and specialist jobs easier to provide. It can also raise exposure, exclusion, and costs when housing and infrastructure lag. The useful questions concern conditions: which people, which neighborhood, which policy, which time period, and which measure?
A better claim: “Rapid peripheral growth increased travel distances because housing expanded beyond frequent transit,” is testable. “Urbanization caused traffic” is too broad to explain the mechanism.
Precise claims improve decisions. If long trips result from job and housing separation, adding road capacity may not fix the cause. If water shortages result from leaks rather than source scarcity, a new reservoir may waste money. Geographic explanation starts by matching the proposed cause to observations at the right scale.
Does urbanization always mean economic development?
Urbanization does not guarantee economic development, although the two often occur together because productive activity concentrates in towns and cities. Development depends on job quality, housing, health, education, infrastructure, institutions, distribution, and environmental costs, not the urban share alone.
A city can grow because it offers expanding industries and rising productivity. It can also grow because rural livelihoods have collapsed, conflict has displaced people, or national investment is concentrated in one capital. In both cases the urban share may rise, but income security and living conditions differ sharply.
To test a development claim, compare more than output. Examine real wages after housing and transport costs, reliable access to water and electricity, school attendance, health outcomes, travel time, air quality, and exposure to eviction or hazards. Averages should be split by neighborhood, gender, age, occupation, or income where the data allow.
Can urbanization slow down or reverse?
Urbanization can slow when the urban share is already high or when rural and urban populations grow at similar rates. It can reverse temporarily if urban residents leave, boundaries change, disasters strike, industries close, or rural populations grow faster.
Counter-urbanization describes movement away from large cities toward smaller settlements or rural areas. It may follow high housing costs, retirement, remote work, industrial decline, or a search for space. Yet a household living beyond the built-up edge may still depend on an urban job and services, so administrative de-urbanization can coexist with a wider functional city.
Suburbanization is not usually the opposite of urbanization. It redistributes people and activity within an urban region, often from the center toward the edge. If those suburbs remain urban by density, function, or official classification, the national urban share does not fall.
How definitions can create apparent reversals
National statistical agencies and governments usually define urban places for censuses and administration, while researchers may build comparable definitions from density, built-up land, or commuting. Every definition serves a purpose, and changing it can alter the result without changing the ground.
An administrative definition helps assign budgets and legal powers. A morphological definition identifies continuous built form. A functional definition captures commuting and economic connections. None is universally best. A transport planner may need the functional region, while an engineer maintaining municipal pipes needs the service boundary.
Whenever two urbanization figures disagree, ask four questions: What population threshold or criteria were used? Which boundary was drawn? What date does the count represent? Was the same method used in both places or years? These checks often resolve apparent contradictions.
Urbanization makes human geography visible in ordinary choices
Urbanization reveals how population, economy, environment, and government meet in space. A rent increase, bus route, flooded street, job cluster, or new housing estate is evidence of linked decisions about land, access, networks, and power.
The next time you cross a town or city, notice where building height changes, where sidewalks end, which roads carry buses, and how long it takes to reach work or school. Ask what boundary defines the place and what flows cross it. Those observations turn an abstract urban percentage into a geographic explanation.
The takeaway: Measure urbanization as a changing population share, then explain it through migration, natural increase, reclassification, land markets, infrastructure, and policy. Judge its effects by asking who gains access, who bears costs, and at what scale.
Urbanization is one pattern within the wider study of places, people, and environments. Follow one everyday system, such as a water pipe, bus line, food delivery, or rent payment, and map the rural and urban places it connects. The city will appear less like a container and more like a changing set of relationships.