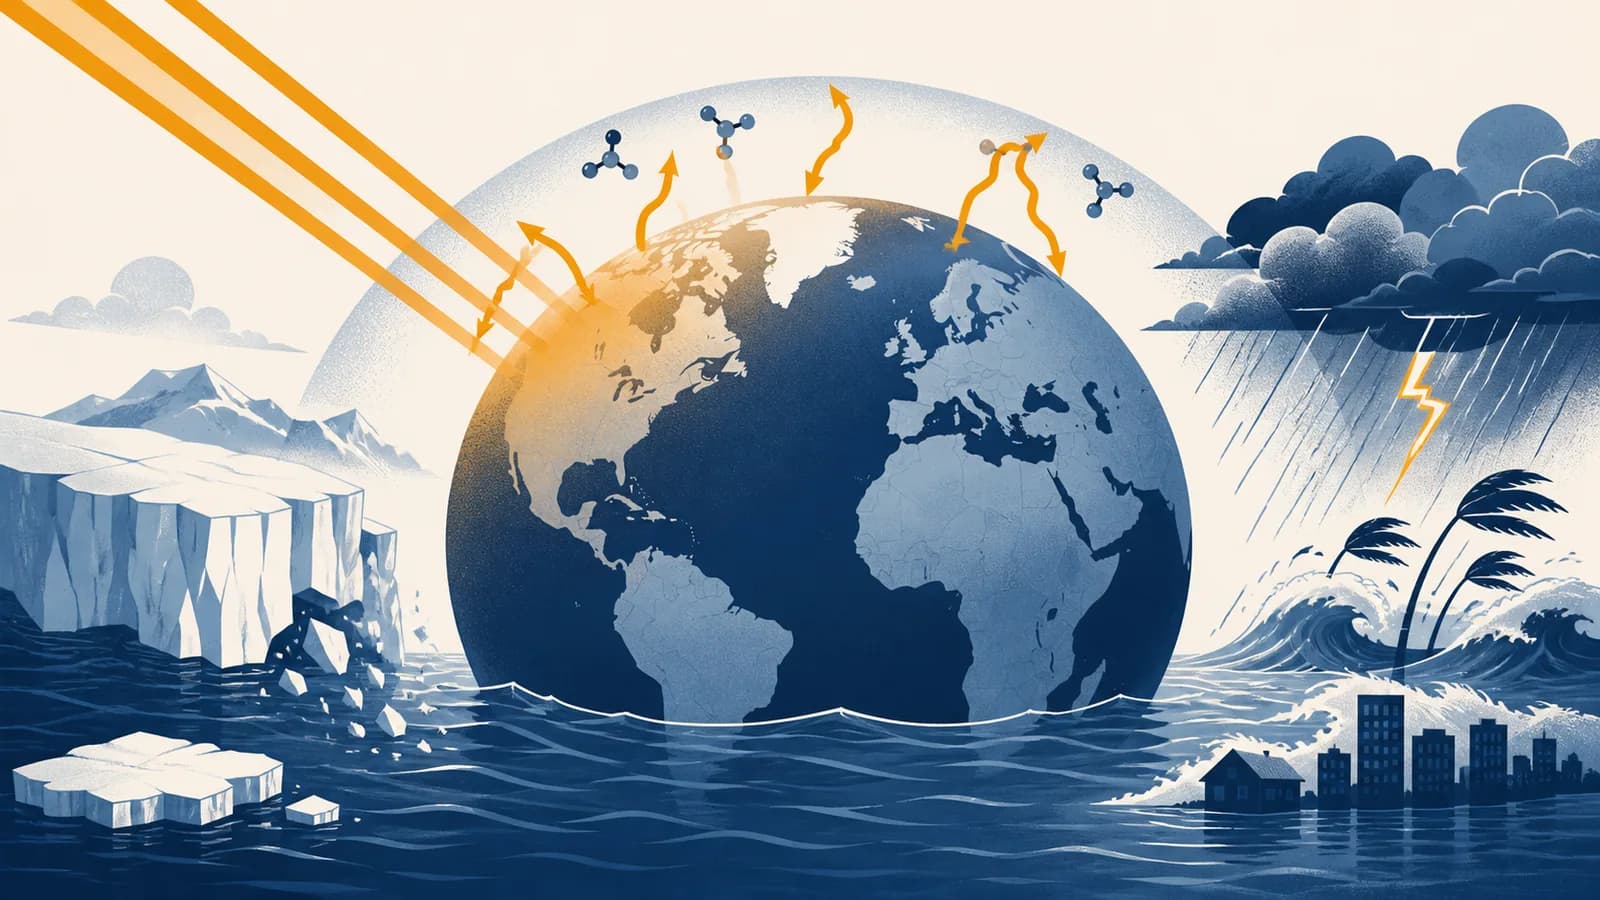
Climate change is a long-term shift in the state of Earth’s climate that alters typical temperatures, rainfall, winds and extremes, in the context of the planet’s connected atmosphere, oceans, ice, land and living systems. Global warming is the rise in average surface temperature within that wider change. The main causes of climate change today are human greenhouse gas emissions, especially carbon dioxide from fossil fuels and land clearance. The greenhouse effect explains how those gases retain energy. Studying climate change exists to explain its causes, measure its effects and choose solutions before hazards become harder and more expensive to manage.
What climate change actually is
Climate change is a persistent change in the average, range or timing of weather over decades or longer. It can affect temperature, rainfall, snow, wind and extremes at local to global scales, rather than making every place steadily warmer each day.
A climate is a statistical description of a place. It includes averages, but averages are only part of it. Two towns can have the same annual mean temperature and still have different climates if one has mild temperatures throughout the year while the other has hot summers and freezing winters. Climate also includes how often conditions occur, how variable they are and when they arrive.
Climate has always changed. Large volcanic eruptions, shifts in solar output, slow changes in Earth’s orbit and movements of continents can all change the planet’s energy balance. Those facts do not explain away modern warming. They give scientists alternative causes to test against observations. The Intergovernmental Panel on Climate Change, or IPCC, concluded in its Sixth Assessment that human activities, mainly greenhouse gas emissions, unequivocally caused recent global warming.
These global figures are not a forecast for every street. Land usually warms faster than ocean, high northern latitudes warm especially rapidly, and rainfall changes form a patchwork. Geography asks why the pattern differs. Latitude, altitude, coastlines, ocean currents, soils, ecosystems, settlement and wealth all affect the result.
How the enhanced greenhouse effect works
The enhanced greenhouse effect works because added greenhouse gases absorb some infrared energy leaving Earth and emit it in all directions. Less energy initially escapes to space, so the lower atmosphere and surface warm until outgoing energy again balances incoming sunlight.
Most incoming solar energy arrives as visible light and nearby wavelengths. Earth’s surface absorbs part of it and warms. Any warm object emits energy, and the cooler Earth emits mainly longer wavelength infrared radiation. Nitrogen and oxygen make up most of the air but interact weakly with much of this outgoing infrared energy. Molecules such as carbon dioxide, methane, nitrous oxide and water vapour can absorb particular wavelengths because their structures allow them to rotate and vibrate in response.
Absorption does not store one packet of heat forever. Molecules collide and exchange energy, then emit infrared radiation in random directions. Some heads upward and some downward. Adding greenhouse gases raises the average altitude from which heat can escape efficiently to space. Air at that higher altitude is colder and radiates less energy, leaving a temporary energy imbalance. The surface and lower atmosphere then warm, increasing emission until balance is restored at a higher temperature.
The natural greenhouse effect makes Earth habitable. The problem is its human enhancement. Burning coal, oil and gas transfers carbon from geological stores into the active atmosphere and ocean system far faster than slow rock processes remove it.
Water vapour is abundant and powerful, but in current climate change it mainly acts as a feedback. Warmer air can contain more water vapour, which strengthens warming. Carbon dioxide acts as a forcing because people directly raise its atmospheric concentration. Cooling does not quickly remove that added carbon dioxide, while water vapour readily condenses and falls as rain or snow.
If a square metre receives an average 240 units and loses 239, the climate system stores 1 unit per unit of time until warming increases the loss.
This balance explains why climate change is measured through several parts of the system. Extra energy can warm air, heat the ocean, melt ice or thaw soil. Surface air temperature is familiar, but it is one indicator within a larger energy account.
Climate change versus weather and natural variability
Weather is the atmosphere’s condition over hours or days, climate is the distribution of weather over decades, and natural variability is fluctuation within that distribution. Climate change moves the distribution itself, altering the odds and possible intensity of particular conditions.
A city reaches 35°C on one afternoon. This records a real event, but by itself it cannot show a long-term trend or identify a cause.
Thirty years of records show that 35°C afternoons have become more frequent, arrive earlier or last longer than in an earlier comparable period.
Picture daily maximum temperature as a spread of values rather than a single average. Natural variability moves individual days around inside that spread. A warmer climate can shift the whole spread toward higher temperatures. An unusually cold day remains possible, but it becomes less common relative to the old climate, while extreme heat becomes more common and can reach values outside the old range.
Variability also works over seasons and years. El Niño moves heat between the tropical Pacific Ocean and atmosphere, changing rainfall and temperature patterns around the world. Volcanic particles can temporarily reflect sunlight and cool the surface. Neither process creates a century-long rise by itself. Scientists account for them when estimating the underlying trend.
Your town has its wettest week on record after several dry years. The week is weather, the sequence of dry and wet years is variability, and a persistent change in the frequency or intensity of such periods is climate change. A sensible claim needs a long record and a physical explanation.
This distinction protects reasoning in both directions. One snowstorm does not disprove global warming, and one heatwave does not prove its full cause. Evidence comes from patterns across time, space and different measurements.
How scientists know humans are causing current warming
Scientists attribute current warming to people by combining physical theory, direct measurements, historical records, chemical evidence and model tests. Human and natural influences are compared, and only simulations including human greenhouse gases reproduce the scale and pattern of observed long-term warming.
Thermometers, satellites, ocean instruments, glaciers, sea ice and sea level records provide independent observations. Agreement among different instruments and research groups makes a simple measurement fault unlikely.
Researchers measure greenhouse gas concentrations, volcanic aerosols, solar changes, reflective air pollution and land cover. Each influence has a known or measurable effect on Earth’s energy budget.
Greenhouse forcing should warm the lower atmosphere while cooling the stratosphere, warm nights as well as days, increase ocean heat and alter infrared radiation at the wavelengths greenhouse gases absorb. Observations show these expected patterns.
Climate models are run with natural causes alone and then with both natural and human causes. The comparison asks which combination produces patterns consistent with the measured world.
The carbon itself leaves evidence. Fossil fuels come from ancient plant material and contain a characteristic balance of carbon isotopes. As fossil carbon enters the air, atmospheric carbon dioxide rises while its isotopic composition shifts in the expected direction. Oxygen also declines slightly because combustion consumes it. This is a chemical account of where much of the added carbon came from.
Models are not crystal balls. They are coded versions of physical laws for motion, energy, water and radiation, calculated across a three-dimensional grid. A model cannot say what the weather will be in one town on a date many decades away. It can test how the distribution of weather changes under a specified forcing and whether large-scale patterns match observations.
Past climate records show that natural change is real and that climate responds to energy imbalances. They also show that known natural drivers cannot account for the present combination of rising greenhouse gases, ocean heat gain and atmospheric fingerprints.
How feedbacks amplify or limit climate change
A climate feedback is a process triggered by an initial change that then strengthens or weakens that change. Positive feedbacks amplify warming, negative feedbacks oppose it, and their combined size helps determine how much temperature changes for a given forcing.
Water vapour amplifies an initial warming
Warm air can hold more water vapour before saturation. Because water vapour absorbs infrared radiation, extra moisture strengthens the greenhouse effect. Carbon dioxide starts much of the long-term warming, and water vapour magnifies it. It is a response to temperature as well as an influence on temperature.
Ice loss lowers reflectivity
Snow and ice reflect a large share of incoming sunlight. Darker ocean or ground absorbs more. When warming melts snow or sea ice, the exposed surface gains more solar energy and adds warming. This ice-albedo feedback is one reason high northern latitudes can warm faster than the global average.
Warmer Earth emits more energy to space
A warmer surface and atmosphere emit more infrared energy. This response opposes the original imbalance and is the main stabilising feedback. Without it, added greenhouse gases would cause energy to accumulate without the planet approaching a new balance.
Carbon sinks can change
Land plants and oceans absorb a substantial part of human carbon dioxide emissions, but their uptake varies. Heat, drought, fire, ecosystem damage and changes in ocean circulation can weaken some sinks. Plant growth can strengthen uptake in some conditions. Scientists model these processes because emissions and atmospheric concentration are related, but they are not identical.
A feedback is not automatically a tipping point. A feedback changes the size of a response. A tipping point is a threshold beyond which part of the system reorganises, sometimes abruptly or with changes that are hard to reverse.
Uncertainty about the exact strength of feedbacks does not mean no knowledge exists. The IPCC’s Sixth Assessment used modern observations, past climates, process studies and models to assess a best estimate of about 3°C of long-term global warming after atmospheric carbon dioxide doubles, with a likely range of 2.5°C to 4°C.
How climate change shows up in real places
Climate change appears geographically as altered heat, water, ice, coastlines and ecosystems. The effect in a particular place depends on the global change, local physical features, who and what is exposed, and the capacity to prepare, respond and recover.
A hazard becomes a disaster through contact with people and assets. A coastal flood is more damaging where homes, roads and power equipment occupy low ground. The same water level may cause less harm where wetlands absorb waves, buildings are raised and warning systems work. Geographers often describe risk through three connected ideas: hazard, exposure and vulnerability.
If stronger heat affects twice as many exposed people, while cooling access halves vulnerability, the simplified product can remain unchanged. Real assessments use more detail, but the structure shows where action can work.
Heat illustrates this local pattern. Concrete, brick and asphalt absorb solar energy, while sparse vegetation provides little shade or evaporative cooling. Night-time heat can persist between buildings. Climate warming raises the background temperature on which this local effect operates. The page on how built-up areas retain extra heat explains the city-scale mechanism in more detail.
Water illustrates a different pattern. A warmer atmosphere can hold more moisture, which can increase the intensity of heavy rainfall when storms have enough water and lift. At the same time, higher temperatures increase evaporation and can dry soils faster. Circulation shifts alter where rain falls. A region can therefore face both heavier downpours and longer dry periods, although the outcome differs by season and location. These processes connect climate change with how limited water supplies become a geographic problem.
Coasts face rising mean sea level because seawater expands as it warms and land ice adds water to the ocean. Higher starting water levels allow tides and storm surges to reach farther inland. Local sea level may rise faster or slower than the global mean because land can sink or rise, currents can change and gravity shifts as ice sheets lose mass.
Ecosystems respond to more than average temperature. Seasonal timing, moisture, fire conditions, ocean heat, acidity and interactions between species all matter. A species may move toward a pole or uphill if suitable habitat exists and movement is possible. A road, farm or city may block that route. Land use is therefore part of climate risk, which is why how forest clearance changes climate and habitats belongs in the same environmental picture.
How climate risk shows up in jobs, law, money and daily decisions
Climate risk enters ordinary decisions whenever weather and long-lived assets meet. Farmers, engineers, insurers, planners, health workers, courts and households use climate information to judge future conditions, reduce exposure and decide who pays for prevention, loss and recovery.
Jobs turn climate data into design choices
An engineer designing a drainage system needs an expected rainfall intensity, not a vague statement that rain may worsen. A farmer chooses crops and planting dates around temperature, soil moisture and seasonal forecasts. A public health team maps older residents, housing quality and tree shade before a heat alert. Each job translates climate data into a decision with costs and consequences.
Law distributes duties and losses
Planning law can restrict construction on floodplains or require buildings to manage heat. Environmental rules can limit emissions. Courts may examine what a company disclosed about financial risks, what a government promised in law or who caused a specific harm. The scientific question of causation is related to legal responsibility, but the standards are different. Science estimates physical contribution and uncertainty; law also considers duties, evidence rules and jurisdiction.
Money turns future risk into present prices
A mortgage, bridge or power station may last for decades. Lenders and insurers therefore care about conditions during the asset’s life, not only last year’s weather. Repeated claims can raise insurance prices or reduce availability. A company may face physical risk from heat or flood and transition risk if policy, technology or customer demand changes.
You are comparing two flats. One costs less but is on a ground floor beside a river; the other is uphill but overheats in summer. Useful questions include flood history, drainage, floor level, shade, ventilation, insurance terms and the expected length of your stay. “Which place is climate safe?” is too broad. Risk has several hazards and changes with the building and its occupants.
Daily decisions also have an emissions side. Home heating, transport, food, products and electricity connect a household to energy and land systems. Personal choices can reduce emissions, but available choices are shaped by rent, income, public transport, building standards and electricity supply. This is why climate policy concerns both behaviour and infrastructure.
How climate solutions work
Climate solutions work through mitigation, which limits the amount of warming, and adaptation, which reduces harm from changes that occur. Effective plans use both, because adaptation cannot prevent every loss and mitigation cannot remove all near-term climate risk.
Mitigation changes flows of greenhouse gases
Mitigation cuts emissions or increases removals. It can replace fossil fuel combustion with low-emission electricity, reduce energy demand, electrify vehicles and heating, change industrial processes, cut methane leaks, protect carbon-rich ecosystems and remove carbon dioxide from air. The practical test is net atmospheric effect across the whole system.
Carbon dioxide warming is closely related to cumulative emissions. A bathtub gives a useful model: emissions are the tap and removals are the drain. Reducing the tap slows the rise, but the level continues rising while inflow exceeds outflow. Net zero carbon dioxide means human additions are balanced by human removals. It stops additional carbon dioxide from accumulating, rather than instantly restoring an earlier climate.
The arithmetic shows why a percentage reduction is progress but not an endpoint. It also shows why claims such as “carbon neutral” need a defined boundary, time period and method. A product can have low emissions at the point of use while its materials, electricity or transport produce emissions elsewhere.
Adaptation changes exposure and vulnerability
Adaptation includes shade trees and cool roofs, drought plans, flood storage, stronger health systems, warning services, crop changes and carefully planned relocation. Good adaptation is specific to a hazard and place. A seawall may protect one district while shifting erosion or creating a false sense of security elsewhere.
How can this decision reduce the greenhouse gases added to the atmosphere or increase durable removals?
How can this decision reduce damage under the climate conditions that people and ecosystems may face?
Some actions do both. Restoring a mangrove can store carbon and reduce wave energy, if the ecosystem survives and local conditions support it. Other actions involve trade-offs. Air conditioning reduces heat exposure but can increase electricity demand and release heat outdoors. The outcome depends on efficiency, refrigerants and how the power is generated.
Four mistakes people make with climate change
Four recurring mistakes are treating weather as climate, confusing uncertainty with ignorance, counting emissions in a convenient boundary and assuming one solution fits every place. Each mistake removes information needed to explain cause, measure risk or judge an action fairly.
1. Using one event as the whole argument
A hot day can fit a warming climate, and a cold day can occur within it. Neither settles the trend. Check a long record, compare like seasons and locations, and look at the distribution of values. Then ask if the proposed physical cause matches other evidence.
2. Treating a range as no answer
Climate projections often give a range because future emissions, natural variability and model response are not perfectly known. A range still supports decisions. A bridge designer does not need to know the exact peak flood in advance to recognise that a wider plausible range requires a safety margin.
3. Moving emissions outside the boundary
A city can report lower local emissions after closing a factory while importing the same goods from elsewhere. Its territorial account improves, but its consumption footprint may not. Neither measure is automatically wrong. The mistake is presenting one boundary as if it answers every question.
4. Copying a solution without its geography
A tree species suited to one climate may fail in another. Dense development can support public transport, but poor design can trap heat. Hydropower can provide low-emission electricity, but rainfall, river ecology and displacement matter. A solution must be tested against local hazards, resources and communities.
Those four details form a quick checking method. Ask which years are compared, which area is measured, what reference period defines change and which emissions or effects sit inside the count. Many apparent disagreements become clearer once those choices are visible.
How scientists connect one extreme event to climate change
Event attribution estimates how climate change altered the probability or intensity of a particular event. Researchers compare the observed climate with a modelled world without human influence, while accounting for natural variability and the physical processes that produced the event.
The answer is usually a change in odds or severity, not a claim that climate change was the event’s only cause. For a heatwave, researchers may compare how often the observed temperature threshold appears in the factual and counterfactual worlds. For a flood, rainfall attribution is only one part of the story because drainage, soil saturation, river engineering and settlement affect damage.
Attribution is strongest where observations are good, models represent the relevant process and the climate signal is clear. Heat extremes often meet these conditions better than small, short-lived storms. A careful result states the event definition, region, dates, models and uncertainty.
How quickly temperature and sea level can respond
Global temperature can stabilise after net carbon dioxide emissions reach zero, but sea level and some ecosystems respond for much longer. Different parts of the climate system have different response times, so stopping warming does not instantly reverse every consequence.
Air adjusts quickly, the upper ocean responds over years to decades, the deep ocean exchanges heat more slowly, and large ice sheets can respond over centuries or longer. This lag stores consequences. The IPCC assesses that sea level will remain elevated for thousands of years because deep-ocean warming and ice-sheet loss reverse very slowly.
Actual cooling requires net removal of carbon dioxide large enough to exceed remaining emissions, and the response will not be identical across the system. Forest growth can remove carbon, but fire or clearance can release it again. Geological storage is designed to be more durable but requires energy, infrastructure, monitoring and suitable rock.
The takeaway: Every fraction of a degree avoided reduces additional risk. Climate action is not an all-or-nothing test, and delay cannot be repaired simply by acting faster later because carbon accumulates and some changes persist.
Climate change makes geography a study of connected decisions
Climate change links physical geography with human geography because energy, water, land, ecosystems, settlements and power shape one another. Reading that connection helps people locate causes, compare unequal risks and choose actions suited to actual places.
A useful habit is to inspect a climate claim as a map with causes attached. Identify the scale, period and baseline. Trace the mechanism from an emission or land change to an energy imbalance, then to a hazard. Mark who or what is exposed. Finally, ask which decision could change emissions, exposure or vulnerability.
Watch your own area for evidence that can be checked: the position of new shade, the height of a flood mark, the route of a bus, the surface around a thermometer, the age of a drainage design or the wording of an insurance exclusion. These details turn a global process into geographic questions without mistaking one observation for the whole climate.
Climate change also shows why scale matters. A household can improve insulation, a city can redesign streets, a national government can set electricity rules and countries can coordinate emissions targets. Each level controls different tools. For more on spatial patterns, physical processes and human decisions, place this topic within the wider collection of geography explanations.