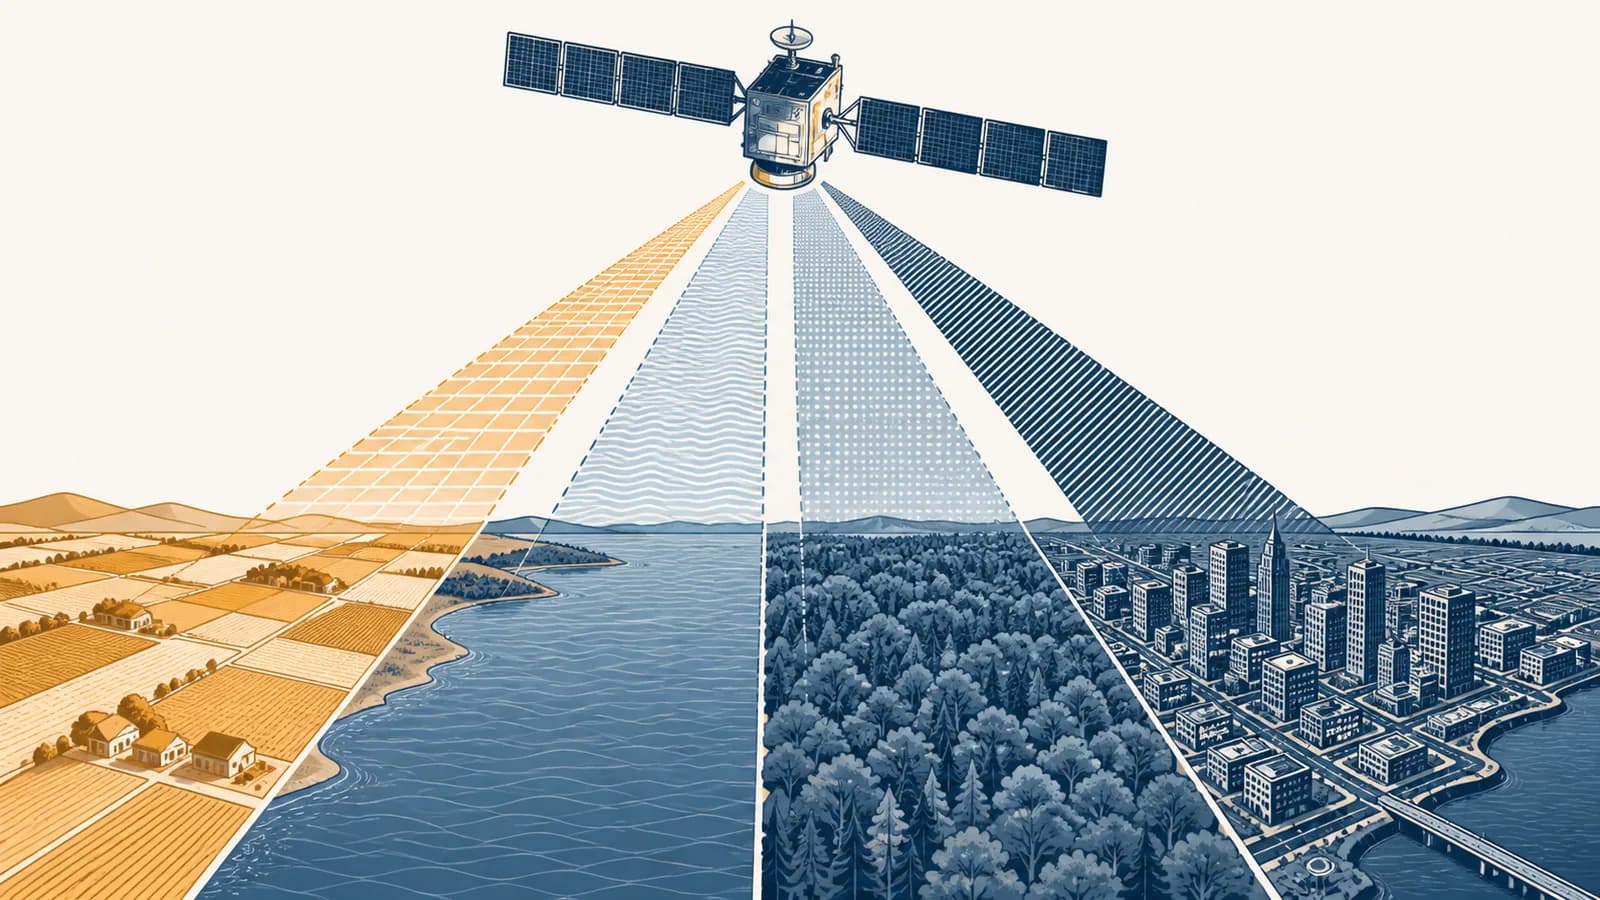
Remote sensing is a measurement method that detects and records Earth's surface without direct contact, in the context of geography.
Satellite imagery, aerial photography, radar, thermal imaging, and LiDAR are remote sensing technologies. Each uses a sensor to measure energy reflected or emitted by land, water, vegetation, buildings, or the atmosphere. Remote sensing exists because many geographic patterns are too large, distant, dangerous, or fast-changing to measure only from the ground. It lets people compare places repeatedly, including coastlines after storms, crop fields during drought, and cities as they expand.
What remote sensing actually is
Remote sensing is the collection of information about a target from a distance by measuring electromagnetic energy. A sensor records how the target reflects, absorbs, emits, or scatters that energy, and analysts turn the measurements into maps, images, and estimates.
The term has two important parts. Remote means the instrument does not touch the feature being measured. Sensing means the instrument responds to a physical signal. A camera on an aircraft senses visible light from a forest. A thermal instrument on a satellite senses infrared energy emitted by that forest. A radar antenna sends microwave energy toward the ground and measures the return.
The result is not automatically a normal photograph. It is usually a grid of cells called pixels. Each pixel stores one or more measured values for a patch of ground. Those values may represent reflected red light, surface temperature, radar return strength, or the time taken for a laser pulse to travel to a surface and back.
A numerical response to energy arriving at the instrument, tied to a position and a time.
A geographic property such as vegetation condition, flood extent, ground height, or land cover.
Remote sensing therefore involves inference. The sensor does not record a label saying “wheat field” or “burned forest.” It records signals. People use physics, field observations, and classification methods to connect those signals to real features on Earth.
A remote sensing image is a measurement grid. Its colors may represent light outside human vision, calculated indices, or radar strength rather than the colors a person would see.
How passive and active sensing work
Passive sensors measure energy already present, usually sunlight reflected from Earth or heat emitted by it. Active sensors transmit their own energy and measure the return, which allows instruments such as radar and LiDAR to control the signal they send.
Passive sensors use an outside energy source
A passive optical sensor works much like a carefully calibrated digital camera. Sunlight passes through the atmosphere, strikes a surface, and interacts with its material. Some wavelengths are absorbed and others are reflected. Part of the reflected energy travels back through the atmosphere and reaches the sensor.
Green leaves absorb much of the visible red and blue light used in photosynthesis, reflect some green light, and strongly reflect near infrared light. Water absorbs much of the near infrared energy that reaches it. Dry soil often shows a different pattern again. Measuring several wavelength bands gives each material a spectral signature, although moisture, season, viewing angle, and surface roughness can change that signature.
Thermal remote sensing is also passive, but it does not depend mainly on reflected sunlight. Any object above absolute zero emits electromagnetic radiation. A thermal sensor measures part of that emitted infrared energy. After correction for atmospheric effects and the material's emissivity, the signal can be used to estimate surface temperature.
Active sensors create the signal they measure
Radar sends microwave pulses and records how strongly and how quickly they return. Smooth water often reflects radar energy away from the antenna and appears dark. Rough ground and complex structures scatter more energy back. The exact response also depends on wavelength, polarization, moisture, and viewing geometry.
LiDAR sends laser pulses and measures travel time. Since light travels at a known speed, the instrument can calculate distance. If the pulse travels to a tree canopy and back in 0.000006 seconds, its total path is about 1,799 metres using the defined speed of light. The one-way range is half of that, about 899 metres.
With and , the range is about . Division by two accounts for the outward and return paths.
Active sensing has a practical advantage: it can work without sunlight. Many radar wavelengths also pass through cloud, so radar can observe the ground during storms or long cloudy periods. This does not make radar an all-purpose replacement for optical images. Radar and optical instruments respond to different surface properties.
How a sensor turns energy into geographic evidence
A usable remote sensing product is built through a chain of measurement, calibration, location correction, interpretation, and checking. Each stage removes a source of distortion or adds meaning, so the final map can support a geographic claim rather than display raw numbers.
Choose a measurable target, such as open water after a flood, instead of asking vaguely what happened.
The platform moves along its path while the sensor records selected wavelength bands or transmitted pulse returns.
Instrument response is converted into a physical quantity such as radiance, reflectance, temperature, or range.
Orbit or flight data, terrain height, and known ground locations are used to align pixels with coordinates.
An analyst compares bands, calculates an index, traces boundaries, or applies a classification model.
Field measurements, trusted maps, or independent images test how often the interpretation is correct.
Calibration matters because a raw digital number depends on the instrument. A detector may respond differently as it ages, and two sensors may assign different values to the same amount of incoming energy. Calibration provides a relationship between detector output and a physical measurement. Atmospheric correction then estimates what the surface signal would be without scattering and absorption along the path.
Geometric correction handles another problem. A satellite image can be shifted or stretched by Earth rotation, platform movement, viewing angle, and relief. A mountain top appears displaced relative to its base when viewed from the side. Orthorectification uses a terrain model and sensor geometry to reduce these effects, making the image line up with a coordinate system.
An analyst compares radar images collected before and after heavy rain. Areas that become dark in the later image may be smooth floodwater. The analyst excludes permanent lakes, checks steep terrain where radar shadow also looks dark, and visits accessible sites or compares local reports before calculating flooded area.
The last check is often called validation or accuracy assessment. Suppose 200 independently checked locations include 100 flooded and 100 dry sites. If the map correctly labels 90 flooded sites and 94 dry sites, it is correct at 184 of the 200 test locations, or 92 percent for that particular sample. That arithmetic does not prove equal accuracy everywhere. It describes performance on the selected checks.
Spatial, spectral, temporal, and radiometric resolution measure different things
Remote sensing resolution has four main dimensions: ground detail, wavelength detail, repeat timing, and sensitivity to signal differences. A sensor can perform well in one dimension and poorly in another, so “high resolution” is incomplete unless the dimension is named.
Spatial resolution controls visible ground detail
A 10 metre spatial resolution pixel represents a ground cell about 10 metres by 10 metres when the product is described that way. Its area is therefore 100 square metres. A rectangular field measuring 300 metres by 200 metres covers 60,000 square metres, so it spans about 600 such pixels if its edges align neatly with the grid.
A pixel is an average or combined response from its ground footprint. If half a pixel covers water and half covers concrete, the recorded value can be a mixture. This is called a mixed pixel. Smaller pixels can separate smaller features, but they also create larger files and may collect less energy per detector element.
Spectral resolution separates wavelengths
A normal color image usually combines broad red, green, and blue bands. A multispectral sensor also records selected bands such as near infrared or shortwave infrared. A hyperspectral sensor divides a wider part of the spectrum into many narrow, adjacent bands. Narrower bands can distinguish subtle absorption features, but they demand more data and careful calibration.
Temporal resolution controls how often change can be seen
A rapidly repeating observation can catch a flood near its peak or follow a crop through its growing season. A detailed image collected only occasionally may miss a short event. Cloud can also reduce the effective repeat rate of an optical system because a scheduled observation is not necessarily a clear observation.
Radiometric resolution separates signal levels
An 8 bit detector can represent possible digital levels. A 12 bit detector can represent levels. More levels allow finer numerical distinctions within the instrument's range, but they do not repair blur, cloud, poor calibration, or weak contrast between materials.
Remote sensing versus photography, GPS, and GIS
Remote sensing measures properties from a distance, photography records an image using light, GPS calculates a receiver's position, and GIS stores and analyzes geographically referenced data. They often work together, but each answers a different part of a geographic problem.
Aerial photography is one form of remote sensing when a camera records the ground from an aircraft or drone. The categories are not opposites. Remote sensing is broader because it includes thermal sensors, radar, LiDAR, and other instruments that do not produce an ordinary color photograph.
A satellite image does not use GPS to measure reflectance. The optical or radar sensor makes that measurement. Position and timing systems help determine where the measurement belongs. A field team may also use satellite based positioning and GPS methods to record the coordinates of training sites, road damage, or water samples used to check an image.
GIS is the environment in which remote sensing products are often combined with boundaries, roads, population data, elevation, and field observations. The image supplies measured evidence about the surface. GIS layers and geographic analysis make it possible to ask which farms overlap a drought signal or which buildings lie inside a mapped flood zone.
| Tool | Main output | Typical question |
|---|---|---|
| Remote sensing | Measured image or derived surface product | Where has vegetation condition changed? |
| Aerial photography | Visible or near visible image from an aircraft | What roof or road features can be seen? |
| GPS | Position, time, and sometimes movement | Where is this sample or vehicle? |
| GIS | Combined layers, queries, models, and maps | Which people or assets overlap the affected area? |
Cartography is different again. It is concerned with designing maps that communicate spatial information. A mapmaker chooses scale, symbols, labels, classification breaks, and visual hierarchy. The source may be remote sensing, a census, fieldwork, or all of them. Remote sensing creates evidence; cartographic design decides how selected evidence is presented.
How remote sensing shows up in environmental work and public decisions
Remote sensing supports decisions by showing the location, extent, condition, and change of features that are difficult to inspect continuously on the ground. Its value comes from repeated, consistent coverage joined with local knowledge and field evidence.
Weather services observe moving systems
Weather satellites track clouds, water vapor, surface temperature, and storm structure. A sequence of images reveals movement that one observation cannot. Geostationary satellites remain above roughly the same region of Earth as the planet rotates, which supports frequent viewing. Polar orbiting satellites pass over different strips as Earth turns beneath them, building broader coverage with another viewing geometry.
Meteorologists do not identify rainfall simply because a cloud looks white. Visible images show reflected sunlight, infrared channels indicate temperatures associated with cloud tops and surfaces, and microwave instruments respond to properties of water and ice. Forecasting combines those observations with ground stations, radar, weather balloons, and physical models.
Farmers and scientists compare crop condition
Healthy green vegetation commonly absorbs red light and reflects near infrared light. The Normalized Difference Vegetation Index compares these bands. It produces values between and when reflectance values are used, although interpretation depends on the surface, sensor, atmosphere, and season.
If near infrared reflectance is and red reflectance is , then .
A higher NDVI in that example is consistent with dense green vegetation, but it is not a direct meter reading of crop yield. Soil brightness, sparse cover, haze, leaf structure, and water stress can influence the signal. Agronomists compare images across suitable dates, inspect fields, and use crop knowledge before recommending irrigation or treatment.
Emergency teams map hazards and damage
Radar can map water through cloud during a flood. Thermal sensors can identify unusually hot areas associated with active fires, while optical images can show smoke, burn scars, and damaged vegetation when visibility permits. After an earthquake, fine spatial imagery can help identify blocked routes and building damage, but field teams must confirm conditions that roofs and shadows conceal.
A river has crossed several roads after days of rain. An emergency team overlays a new radar flood map with road and settlement data. It sends crews first toward routes that appear dry and connect the largest isolated communities, while local reports check bridges that a satellite pixel cannot diagnose.
Planners and conservation teams measure long change
Images taken under comparable conditions can show forest clearing, wetland loss, shoreline movement, mine expansion, and new construction. The work is strongest when analysts define the change precisely. “Tree cover became non-tree cover” is a measurable classification change. “The ecosystem was destroyed” is a broader ecological claim that needs field evidence about species, soil, water, and causes.
Repeated observations also support habitat monitoring and conservation decisions. A map may reveal where a forest patch has become isolated or where surface water persists through a dry period. Rangers and ecologists then decide what the pattern means on the ground and what action is justified.
Five mistakes people make with remote sensing
Most remote sensing errors come from treating a measured signal as if it were a direct, complete description of reality. Good analysis keeps the physical signal, processing choices, geographic context, and independent checks visible at every stage.
1. Treating pixel color as the measured property
A displayed color is often assigned by software. In a false color vegetation image, near infrared values may be shown as red, so healthy plants look bright red. That choice makes a pattern easier to see. It does not mean the leaves are red or that the satellite measured a color called “vegetation.”
2. Assuming smaller pixels guarantee a better answer
Fine spatial resolution helps when the target is small, but it cannot compensate for the wrong wavelength, wrong date, or poor calibration. A large field may be monitored effectively with moderate pixels and frequent observations. A narrow stream may require smaller pixels, especially where banks and water mix within cells.
3. Comparing images without making them comparable
A darkening surface might reflect real change, a different Sun angle, haze, soil moisture, sensor settings, or seasonal vegetation. Analysts use calibrated products, similar seasons, cloud masks, atmospheric correction, and stable reference areas. Change detection begins by reducing differences that are unrelated to the target change.
4. Naming a cause from a pattern alone
An image may show that vegetation cover fell, but not why. Drought, harvest, fire, grazing, disease, construction, and a classification error can produce similar mapped changes. Causal claims need timing, local records, field evidence, and tests against competing explanations.
Reflectance and radar patterns changed in these mapped cells between the selected dates.
The change happened because a particular policy, person, storm, disease, or land use caused it.
The distinction protects against confident but unsupported stories. Remote sensing is excellent at locating patterns and screening large areas. Explanation often requires records and people who know the place.
5. Reporting accuracy as one universal percentage
A single overall accuracy can hide important errors. A flood map might identify most dry land correctly simply because dry land covers most of the test area, yet still miss many flooded sites. Analysts examine errors by class, the sampling design, location, season, and the intended decision. A map suitable for regional planning may be unsafe for judging one house.
Resolution is not certainty. A sharply drawn boundary can still come from an uncertain classification, a mixed pixel, an old observation, or a model that was checked in a different place.
How satellites know where each pixel belongs
Satellites locate pixels by combining precisely timed sensor measurements with knowledge of the spacecraft's position, orientation, viewing direction, Earth shape, and terrain. Ground control points and geometric models then align the image to a coordinate reference system.
The sensor records a line or frame at a known time. Orbit information estimates where the satellite was. Attitude measurements describe how the platform was tilted or rotated. The instrument model describes the direction associated with each detector. A ray can then be projected toward an Earth model to estimate the ground intersection.
Terrain complicates the calculation. A ray reaches a mountain slope sooner than it reaches a flat reference surface, and side-looking sensors create displacement that varies with height. Orthorectification uses elevation data to place features closer to their true map positions. Analysts test the result against surveyed or otherwise trusted points.
Geolocation error matters most near small features and boundaries. If a flood image and a road layer are slightly misaligned, a dry road can appear flooded. The analyst should compare stated positional accuracy with road width, pixel size, and the consequences of a wrong decision.
What clouds, shadows, and the atmosphere hide
Clouds can block optical views, shadows remove illumination, and gases and particles change energy as it crosses the atmosphere. Analysts respond with cloud masks, atmospheric correction, different dates or viewing angles, and sensors whose wavelengths interact differently with those obstacles.
In visible light, a thick cloud may reflect sunlight before it reaches the ground. Its shadow creates another missing or altered area nearby. Thin haze scatters shorter wavelengths and can brighten an image unevenly. Water vapor and other gases absorb energy in particular wavelength regions, leaving some atmospheric windows more useful for surface observation.
Radar often provides a useful alternative because many microwave wavelengths pass through cloud. Yet radar has its own geometric problems. A steep slope facing the sensor can appear compressed. A slope hidden behind terrain can fall into radar shadow. Smooth water, dry bare ground, and shadow may all look dark for different physical reasons.
No correction creates information that the sensor never received. Good products mark cloud, shadow, saturation, and other low-quality pixels. Users should inspect those quality layers instead of assuming every colored cell has equal evidential value.
Can remote sensing identify objects and people?
Remote sensing can sometimes classify visible objects or detect patterns associated with human activity, but identification depends on pixel size, sensor type, viewing conditions, training data, and context. Seeing an object is different from reliably identifying a person or intent.
A vehicle may occupy several pixels in a very detailed image, allowing software to distinguish a vehicle-shaped object from its surroundings. A coarser image may show only a mixed signal. Even a clear roof view usually says little about what is happening inside a building. Thermal patterns can indicate emitted heat, but many sources can produce similar temperatures.
Machine learning classifiers learn statistical relationships between labelled examples and image measurements. If training data cover only one city, season, or building style, performance may drop elsewhere. Shadows, new materials, and unusual viewing angles can also create errors. A classification confidence score is not proof that the class label is true.
Privacy and law enter the subject because observation can affect people even when faces are not visible. Repeated imagery may reveal construction, traffic patterns, farm activity, or changes at sensitive sites. Responsible use asks who collected the data, what consent or legal authority applies, how precise the result is, and who may be harmed by an incorrect label.
How remote sensing data become maps rather than pictures
Remote sensing data become maps when measured pixels are assigned coordinates, transformed into meaningful classes or quantities, and presented with scale, legend, date, source, and uncertainty. Mapping is an argument about location, not simply an attractive image.
A land cover map may assign each pixel to water, woodland, grass, bare ground, or built surface. The analyst first defines the classes. Training samples connect known locations to spectral or radar measurements. A classifier applies learned rules to other pixels. Independent samples then estimate error. Finally, a legend explains the categories and a scale shows the level of detail.
A continuous map works differently. Surface temperature, elevation, or an index such as NDVI can retain numeric values instead of named classes. The color ramp should match the measurement. Equal steps in the legend should represent equal numeric intervals unless a different classification is explicitly shown.
Map design can exaggerate certainty. Crisp class colors hide gradual transitions and mixed pixels. A narrow legend range can make small temperature differences appear dramatic. Date and source matter because a map of a changing surface is a statement about a particular observation period. Studying how geographic evidence is designed into maps helps a reader judge those choices more carefully.
The sentence separates measurement from interpretation. Both are valuable, but they carry different kinds of uncertainty. A careful map lets a reader trace the path back to the sensor, processing method, classification rule, and validation evidence.
Remote sensing turns physical measurements into geographic decisions
Remote sensing connects geography's concern with place and change to measurable energy, repeat observations, and mapped evidence. Its strongest use is not passive viewing, but testing a specific claim about where something is, how it differs, or how it changed.
The next time a satellite image appears in a weather report, planning proposal, farm dashboard, or news story, look for four things: the sensor, the date, the measured signal, and the method used to assign meaning. Then check whether cloud, resolution, season, or classification error could change the conclusion.
That habit links remote sensing to the wider study of geographic patterns and processes. Geography asks how physical and human systems vary across space. Remote sensing supplies repeatable observations across that space, while fieldwork, local knowledge, and analysis explain what the patterns mean.
The takeaway: Treat every remote sensing product as a chain from energy to sensor, from sensor to pixel, and from pixel to claim. Find the weakest link before using the claim to make a decision.