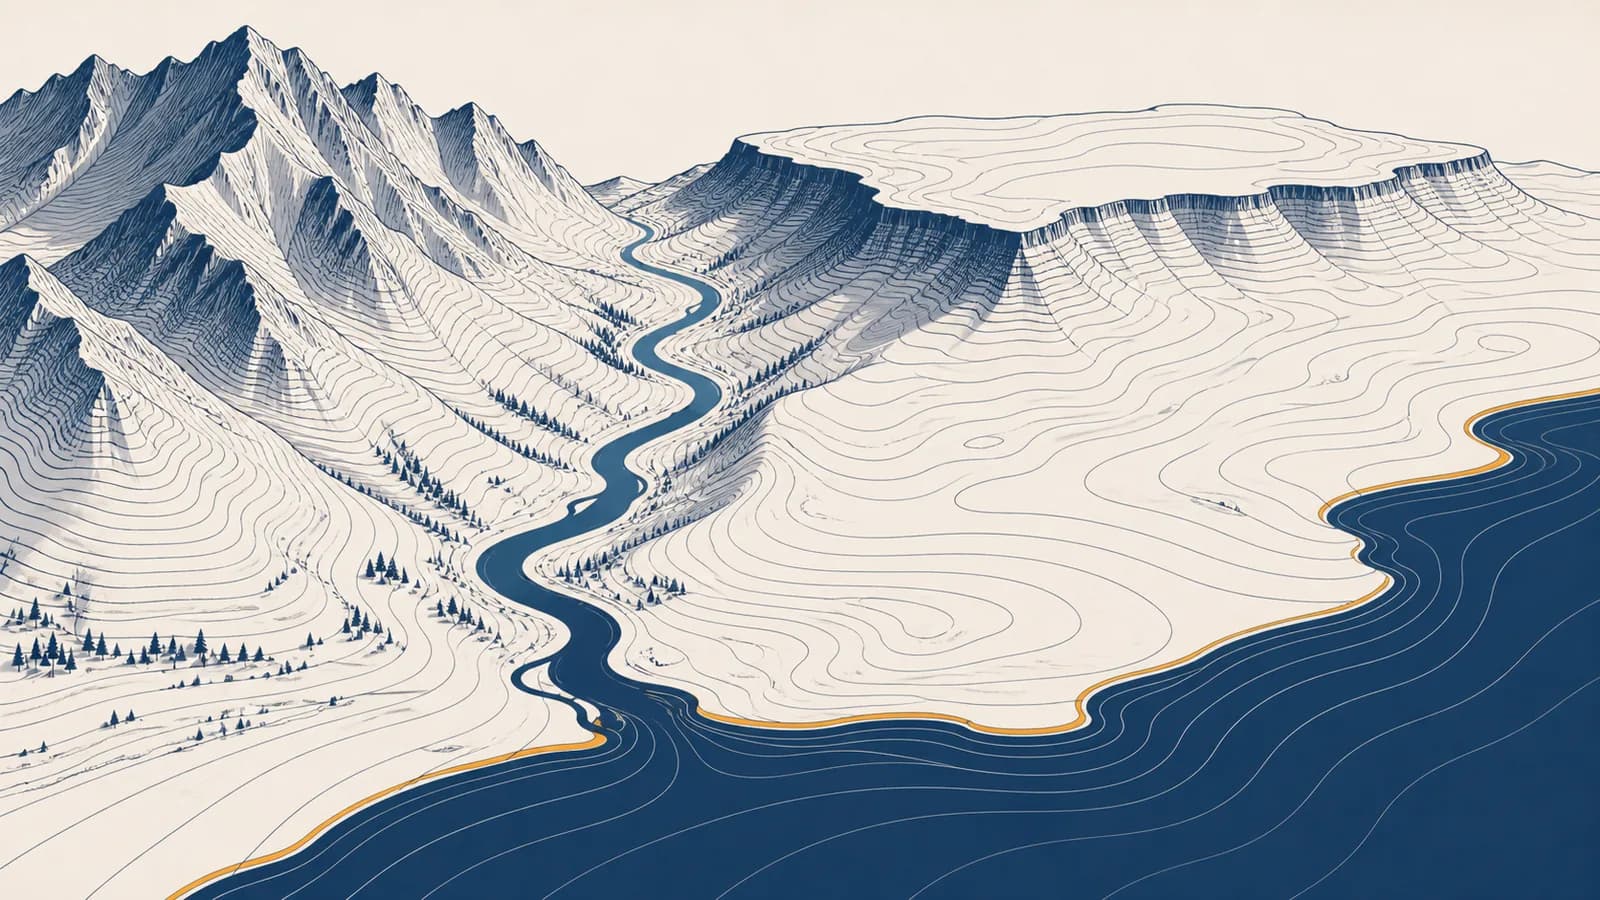
Topography is the arrangement of surface heights and shapes that describes the physical form of land, in the context of geography. It answers the basic questions behind a topographic map: where is the ground high or low, how steep is the slope, which way does water flow, and what landforms occupy the area? Elevation, relief, contour lines, gradient, mountains, valleys, plateaus, and plains are all parts of that description. The idea exists because position alone is not enough. People also need to know the shape of the ground to explain landscapes, choose routes, manage water, build safely, and read environmental change.
What topography actually is
Topography is a measured description of the height, slope, orientation, and shape of a surface. It records how one place stands relative to another, then represents those differences with maps, profiles, shaded relief, digital elevation models, or field observations.
A location on Earth can be described horizontally by latitude and longitude, but topography adds the vertical dimension. Elevation states the height of a point relative to a reference surface, usually mean sea level. Relief is the difference between the highest and lowest elevations in an area. Slope expresses how quickly elevation changes across horizontal distance. Aspect is the compass direction a slope faces.
These properties describe continuous ground. A hill does not begin at a painted boundary, and a valley does not end at an administrative line. Geographers therefore measure points, lines, and surfaces, then choose a scale and a method that make the relevant pattern visible.
Suppose a square survey area has a lowest point at 120 metres and a summit at 470 metres. Its local relief is 350 metres because . That result says nothing about how the height is distributed. One side could rise gently while another ends in a cliff. A full topographic description needs both height and shape.
How elevation, relief, slope, and aspect work
Elevation supplies the vertical measurements, relief compares their range, slope measures the rate of change between them, and aspect gives the direction of descent or exposure. Together they turn a collection of heights into a description of usable terrain.
A surveyor first establishes horizontal position and elevation at selected points. Older field methods used levels, measuring rods, triangulation, and known benchmarks. Modern work can use satellite positioning, aircraft radar, laser scanning, and carefully calibrated ground instruments. Each method produces observations with a stated precision. Software interpolates between them to build a surface, but interpolation does not create new observations. It estimates what lies between measured points.
Percentage slope compares vertical rise with horizontal run. The run is measured horizontally, not along the sloping ground. A path that climbs 30 metres over 600 horizontal metres has a 5 percent average slope.
Worked example: .
A 100 percent slope is not vertical. It rises one unit for every one horizontal unit, which makes an angle of 45 degrees. Slope angle and percentage slope use different scales. The angle can be found with . A vertical face approaches 90 degrees, while its percentage slope has no finite upper limit because the horizontal run approaches zero.
Averaging hides detail. A route with a 5 percent average slope may contain a level section and a much steeper section. Engineers, hikers, and flood modellers need the local slope where conditions change.
Aspect affects what a slope receives. In the Northern Hemisphere, a south-facing slope often receives more direct sunlight than a north-facing slope at the same latitude, although season, cloud, shade, and local geometry also matter. Aspect can influence snowmelt, soil moisture, vegetation, fire behaviour, and the placement of buildings or crops.
How contour lines turn height into a map
Contour lines connect points of equal elevation, allowing a flat map to show a three-dimensional surface. Their labelled heights show vertical position, their spacing indicates steepness, and their repeated shapes reveal ridges, valleys, summits, depressions, and passes.
A mapmaker chooses a contour interval, the fixed vertical difference between neighbouring contour lines. If the interval is 20 metres, lines might represent 100, 120, 140, and 160 metres. The interval stays constant on a given map unless the legend explicitly says otherwise. Closely spaced lines mean elevation changes quickly over a short horizontal distance. Widely spaced lines mean a gentler slope.
Find the contour interval, map scale, north direction, elevation units, symbols, and the reference system used by the map.
Use index contours, which are commonly drawn thicker and labelled, to establish the sequence of elevations.
Closed loops usually enclose a hill or a depression. Contours that cross a stream form a V shape that normally points upstream.
Identify steep faces, gentle approaches, flat benches, and abrupt breaks of slope before selecting a route or interpreting a process.
Transfer contour crossings along a chosen line to graph paper, plot their elevations, and join them smoothly to see a side view of the terrain.
Imagine a stream crossing contours labelled 80, 100, 120, and 140 metres. The bends point toward the 140 metre ground, so upstream lies in that direction. Water travels toward lower elevations, crossing the sequence toward 80 metres. The contour shape gives direction even if no flow arrow is printed.
Contours normally do not cross because one horizontal position on an ordinary ground surface cannot have two elevations. An overhanging cliff is an unusual exception in the real world and requires special mapping treatment. A depression may be shown with short inward ticks, called hachures, so the closed loops are not mistaken for a hill.
Contour maps are selective models. They omit bumps smaller than the mapping purpose, and their apparent detail depends on scale, source data, and contour interval. A neat line is not proof that the ground has been measured continuously along every centimetre.
Topography versus landforms
Topography describes the complete shape and elevation pattern of a surface, while landforms are recognisable physical features within that surface. A topographic map may contain several hills, valleys, ridges, plains, and river terraces, each classified as a landform.
A continuous description based on measurements such as elevation, relief, slope, and aspect. It answers, “What shape is the ground here?”
A named feature identified by shape, position, materials, and often origin. It answers, “What kind of feature is this?”
The distinction matters because similar shapes can have different origins. A cone may be a volcano, an artificial waste heap, or an erosional remnant. A flat surface may be a river floodplain, a raised marine terrace, a lava plateau, or graded construction land. Shape starts the identification, but rock, sediment, drainage, location, and history test it.
Landform categories also overlap by scale. A mountain range contains individual peaks, ridges, cirques, valleys, fans, and channels. A river valley can contain a floodplain, terraces, levees, and abandoned meanders. No single list divides the surface perfectly because features nest inside larger features and change over time.
Geomorphology is the branch of physical geography that studies landforms, the processes that create them, and their development through time. Topographic evidence is one of its main inputs. Geologists add evidence about rock structure and Earth history, while hydrologists focus on water movement through the same terrain.
How landforms are built and changed
Landforms develop through uplift, volcanism, weathering, erosion, transport, and deposition. Tectonic and volcanic processes create relief, while gravity, rivers, ice, wind, waves, organisms, and human activity break material down, move it, and place it elsewhere.
Weathering changes rock in place. Water can react chemically with minerals, temperature change can widen cracks, and roots can force fractures apart. Erosion begins when loosened material is removed. A river rolls gravel, a glacier drags rock fragments, wind lifts sand, and gravity pulls debris downslope. Deposition occurs where the transporting agent loses the energy or capacity to carry its load.
Internal forces raise and fracture terrain
Tectonic movement folds, faults, lifts, or lowers sections of Earth’s crust. Resistant rock can remain high while weaker rock wears away more quickly. Magma reaching the surface builds volcanic cones, lava fields, and calderas. These processes can create new elevation differences faster than ordinary surface erosion removes them.
Running water cuts valleys and builds plains
Water follows gravity along the steepest available descent, collects into channels, and erodes beds and banks. In high, steep terrain, vertical cutting can produce narrow valleys. Where slope decreases, rivers may swing laterally, widen valley floors, and deposit sediment during floods. Over time, channels can leave terraces above a newer floodplain.
Ice reshapes high ground
Moving glacier ice can widen valleys, steepen valley sides, abrade bedrock, and transport mixed debris. Deposited material can form ridges and uneven ground after ice retreats. The mechanisms and resulting features are developed further in the page on how glaciers carve terrain and store water.
Wind and waves sort loose material
Wind removes fine particles, moves sand in short hops, and builds dunes where airflow slows or obstacles trap grains. Waves erode exposed coasts and move sediment along shorelines. Beaches, spits, cliffs, and wave-cut platforms record the balance between rock resistance, sediment supply, water movement, and changing sea level.
Landforms are therefore temporary results of competing rates. Uplift may raise a range while rivers cut into it. A delta may grow while waves redistribute its sediment. A cliff may retreat while fallen blocks briefly protect its base. “Temporary” can still mean much longer than a human lifetime.
How topography shows up in route planning and construction
Topography controls the gradients, drainage paths, sight lines, excavation needs, and unstable slopes that shape roads, buildings, pipelines, farms, and walking routes. Planners compare possible alignments to reduce danger, earth movement, cost, environmental damage, and travel effort.
A rescue team must reach a person 1.2 kilometres away across a ridge. The straight map line crosses tightly packed contours and a cliff symbol. A 1.8 kilometre route follows a gentler spur. The longer route may be faster and safer because horizontal distance alone does not measure travel difficulty.
Road and railway designers cannot ignore gradient. A steep direct line may require deep cuttings, retaining structures, sharp bends, or tunnels. A gentler line may follow a contour, cross a pass, or lengthen through switchbacks. Engineers then test the soils and rock because a smooth contour pattern cannot reveal every weak layer, cavity, or groundwater problem.
Building design also changes the land. A cut removes material from high ground, while a fill raises low ground. Designers try to balance cut and fill where practical because transported material requires vehicles, space, and suitable disposal or placement. Finished surfaces must direct runoff away from structures without concentrating water onto neighbours or unstable slopes.
A farmer reads the same terrain differently. Steep slopes can increase runoff and soil loss, hollows may collect cold air or water, and aspect changes sunlight and evaporation. Terracing, contour cultivation, drainage, crop choice, and access tracks respond to those differences. The interaction between ground shape and land use continues in how soil properties guide agricultural decisions.
How topography controls water, climate, and living systems
Topography redirects water and air, producing drainage basins, rain shadows, temperature differences, wet hollows, exposed ridges, and varied habitats. Small elevation and aspect changes can alter local conditions even where the regional climate and underlying geology remain similar.
A drainage divide is high ground separating neighbouring drainage basins. Rain falling on opposite sides may enter different streams and eventually different rivers. Within a basin, water tends to move downslope as surface runoff or through soil and rock. Channels join into a network because gravity concentrates flow along low paths.
A watershed boundary is traced around the high ground that encloses all drainage toward a chosen outlet. Change the outlet and the relevant watershed changes too. The basin above a small footbridge is nested inside the larger basin of the river downstream.
Choose the point through which all water in the target basin must pass.
Trace ridges and saddles around the streams that feed the outlet, crossing contours roughly at right angles where needed.
Confirm that downhill flow inside the boundary reaches the outlet and downhill flow outside reaches another channel.
Mountains can force moist air upward. Rising air expands and cools, which can encourage condensation and precipitation if enough moisture is present. Descending air on the sheltered side warms and becomes drier relative to its capacity to hold water vapour. This process helps produce a wetter windward side and a drier rain-shadow side, though storm tracks and seasonal winds can complicate the pattern.
Organisms respond to the resulting mosaic. A sheltered hollow may retain moisture, while a nearby ridge experiences stronger wind and thinner soil. Sun-facing and shaded slopes can support different vegetation. Those local controls connect terrain to how climate and land shape ecosystems.
Topography also channels hazards. Floodwater occupies low ground, debris flows follow gullies, avalanches accelerate on suitable slopes, and lava tends to move downslope while its viscosity and cooling alter the exact path. Hazard maps combine elevation data with rainfall, geology, vegetation, past events, and models. Elevation alone is informative, but it is not a complete risk forecast.
What narrow landform names actually mean
Landform names classify repeated shapes and positions, but a correct identification also considers scale and origin. Plains, plateaus, mountains, hills, valleys, ridges, basins, and coastal forms describe useful patterns rather than perfectly fixed natural boxes.
| Landform | Diagnostic shape | Common formation routes | Contour clue |
|---|---|---|---|
| Hill | Local rise above surrounding land | Uplift, deposition, volcanism, or erosion around resistant material | Closed loops with elevation increasing inward |
| Valley | Long low area between higher sides | River incision, glacier erosion, faulting, or structural weakness | Contours form bends that point toward higher ground |
| Ridge | Long narrow crest of high ground | Folding, faulting, volcanism, or unequal erosion | Contour bends point toward lower ground along the crest |
| Plateau | Broad elevated area with relatively level surface | Uplift, lava accumulation, or erosion that leaves a resistant surface | High elevation with wide spacing on top and close spacing at edges |
| Plain | Broad area of low relief | Sediment deposition, erosion, lava flows, or exposure of a level surface | Few contours or very wide spacing |
| Basin | Area lower than surrounding ground | Subsidence, faulting, erosion, impact, or dissolution | Enclosing high ground, with drainage directed inward or toward an outlet |
| Pass or saddle | Low point between two higher points | Erosion or structure between adjacent uplands | Contours pinch into an hourglass pattern |
A hill and a mountain differ more by relative size, steepness, local naming, and context than by one universal height threshold. Some mapping agencies and local traditions use operational definitions, but no single global rule settles every case. The map evidence should therefore describe measured relief and slope instead of relying only on the name.
A plateau is elevated relative to nearby land and comparatively level across its upper surface. A plain is primarily defined by low relief, not necessarily by low elevation. This is why “flat” and “low” are not synonyms. A high plateau can have less local relief than a low range of hills.
How scale and resolution change what a map reveals
Map scale states the relationship between map distance and ground distance, while spatial resolution describes the smallest ground detail represented by the data. Together with contour interval and accuracy, they determine which slopes and landforms can be seen or measured reliably.
A representative fraction of 1:25,000 means one unit on the map equals 25,000 of the same units on the ground. One centimetre therefore represents 25,000 centimetres, or 250 metres. Four centimetres represent one kilometre. The arithmetic is exact for the stated scale, although printing or resizing a digital image can change the physical scale unless a scale bar changes with it.
Worked example: .
In conventional mapping language, a large-scale map shows a smaller area with more detail, such as 1:10,000. A small-scale map shows a larger area with less detail, such as 1:1,000,000. The terminology follows the size of the fraction: is larger than .
A digital elevation model divides the ground into cells or builds a mesh of measured points. A cell value represents an elevation assigned to that area, not every pebble and ditch inside it. Coarse cells can smooth narrow ridges and channels. Fine cells can show smaller features, but greater resolution does not automatically guarantee greater accuracy. Sensor error, vegetation, buildings, interpolation, and the date of collection still matter.
Do not claim centimetre precision from a coarse map. Measurements should match the source data. Extra decimal places make a result look exact without adding real information.
Scale also changes classification. At continental scale, a mountain range may appear as one belt of high relief. At local scale, the same belt separates into peaks, saddles, cliffs, gullies, and terraces. Both views can be correct because they answer different questions.
How elevation is measured without confusing height references
Elevation is found by relating a point to a defined vertical reference, using levelling, satellite positioning, radar, laser scanning, or pressure measurements. The reported number is meaningful only when its reference surface, units, method, and expected uncertainty are known.
Mean sea level sounds like a simple global zero, but the ocean surface varies with tides, currents, atmospheric pressure, gravity, and coastline shape. Mapping systems use carefully defined vertical datums and mathematical models rather than treating the visible waterline on one day as universal zero.
Satellite navigation can determine height relative to a mathematical ellipsoid. Maps often report elevation relative to a gravity-based surface called the geoid. Software can convert between the two when it has the appropriate model. If two devices use different references, their height readings may disagree even when both instruments are working correctly.
Aircraft and drones can collect overlapping images for photogrammetry. Laser scanning, often called lidar, measures travel time for emitted light pulses and can produce dense point clouds. Radar can map broad areas through cloud. Each method handles vegetation, water, steep faces, and buildings differently, so surveyors choose the source that fits the job and check it against known points.
A phone reports that a walker is at 640 metres, while a trail sign says 625 metres. Before deciding that one is wrong, check the vertical datum, sensor accuracy, map age, and whether the sign refers to the pass, the path junction, or another surveyed point.
Pressure altimeters estimate height from air pressure. They are useful for tracking changes, but weather also changes pressure. A careful user calibrates the instrument at a known elevation and updates it when conditions shift. The measurement is a model-based estimate, not direct sight of an invisible height line.
Four mistakes people make with topography
The most common errors are reading contour spacing as elevation, assuming water follows the shortest map line, treating map detail as perfect ground truth, and naming landforms by shape alone. Each mistake drops one part of the evidence needed for a sound interpretation.
1. Close contours mean high elevation
Close contours mean steep slope, not necessarily high ground. A steep sea cliff can stand at modest elevation. A broad plateau can sit much higher while its contours remain widely spaced across the top. Read the labels for elevation and the spacing for gradient.
2. Water always travels south or along the shortest line
Water responds to downhill gradient, not compass direction or shortest horizontal distance. A river can flow north, curve around a ridge, and descend gradually for many kilometres. Compare elevations and trace connected low ground. Contours crossing streams usually point upstream, which helps establish flow direction.
3. A detailed map is an exact copy of the ground
Every topographic product has a collection date, resolution, accuracy, scale, and selection of features. Erosion, construction, vegetation clearance, landslides, and river movement can alter the terrain after mapping. Small banks and pits may be below the chosen resolution. Field checks remain necessary where errors could cause harm.
4. Shape proves how a feature formed
Shape narrows the possibilities but does not settle origin. A U-shaped valley suggests glacial erosion, yet the conclusion needs supporting evidence such as scratched bedrock, transported sediment, or regional ice history. A circular depression might result from volcanic collapse, impact, dissolution, excavation, or mining subsidence.
The takeaway: Read topography as a connected system. Use labelled elevation for height, contour spacing for slope, contour shape for terrain structure, drainage for downhill relationships, and independent evidence for landform origin.
This habit improves both map reading and judgement. It turns a pattern of lines or pixels into testable statements about the ground, while keeping the limits of the evidence visible.
Topography makes physical geography visible in everyday choices
Topography connects Earth processes to particular places by showing where land rises, falls, collects water, exposes slopes, and constrains movement. Reading those relationships helps explain landscapes and supports practical choices about routes, construction, farming, hazards, habitats, and environmental change.
The next time a road bends, a settlement occupies a terrace, or vegetation changes across a slope, look for the shape beneath it. Identify the high and low ground, predict the drainage, compare the steep and gentle sides, and ask which process could have produced the form. Those observations link this topic to the wider set of geography explanations without separating physical systems from human decisions.
A good topographic reading ends with a prediction that can be checked. Predict where runoff will gather, which route will require less climbing, or where a ridge blocks the view. Then compare the prediction with the ground, an image, or better data. Geography becomes more exact when the map is treated as a model of relationships rather than a picture to memorise.