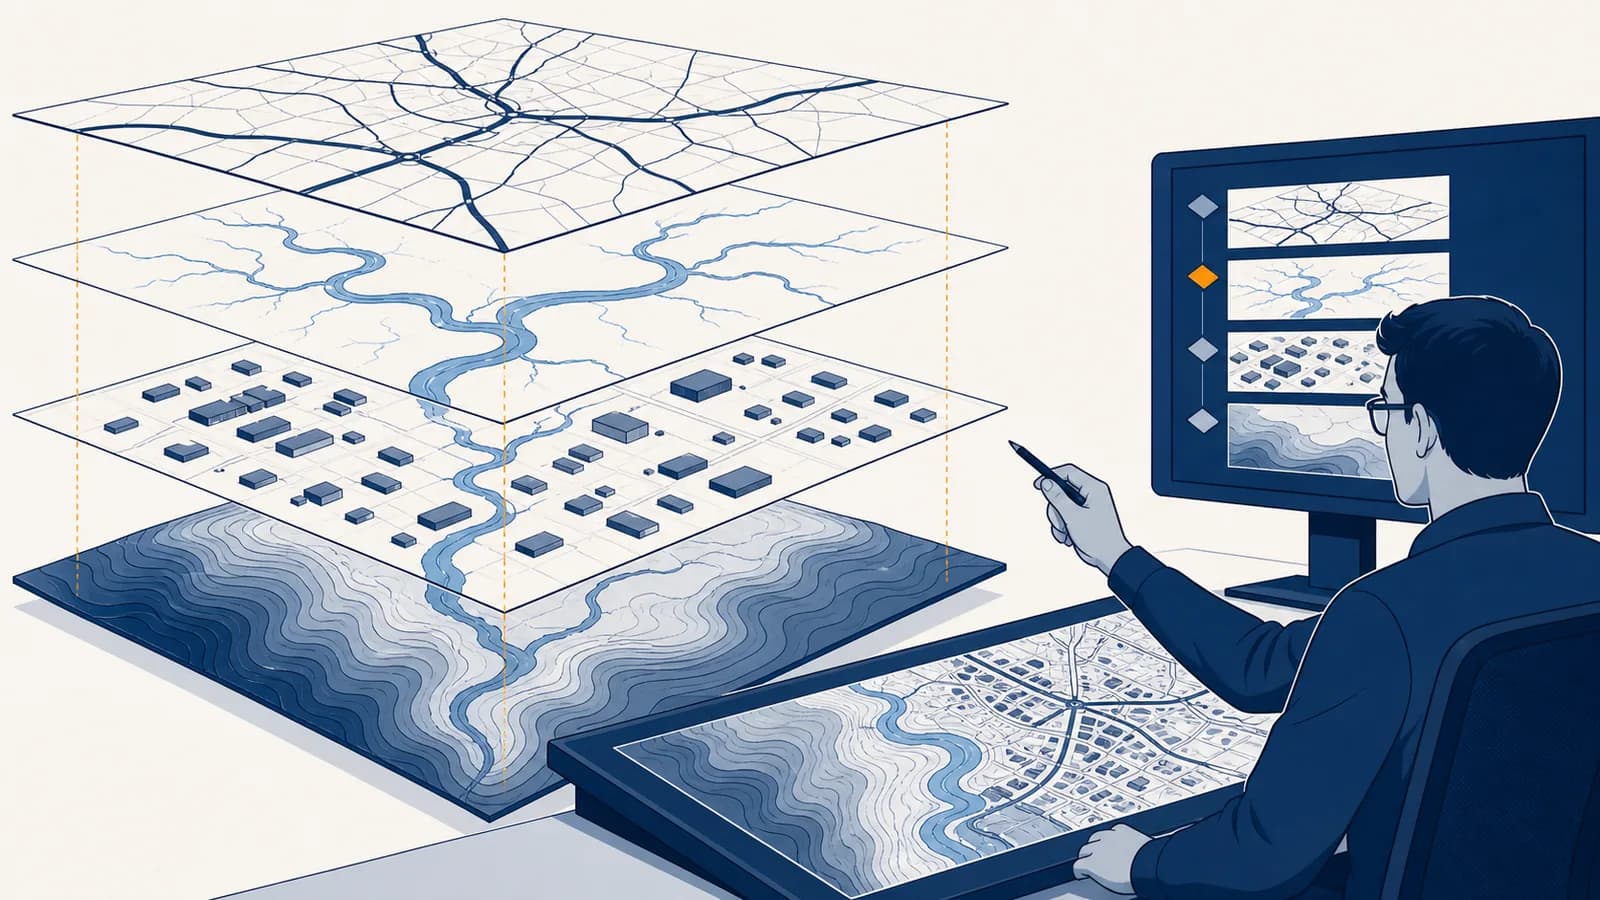
Geographic Information Systems (GIS) is a computer-based system that stores, maps, combines, and analyzes data tied to location, in the context of geography. A GIS answers questions such as what is here, what is nearby, where a pattern occurs, and how a place has changed. GIS mapping exists because many decisions depend on relationships that tables alone hide. It connects each record to coordinates, lines, areas, or grid cells, then lets a user compare those features by distance, overlap, direction, and time.
What GIS actually is
A GIS is a linked set of spatial data, descriptive data, software tools, methods, and people. Its defining ability is not drawing a map. It is preserving the location of each feature so that geographic relationships can be measured and tested.
Suppose a city has one spreadsheet of fire hydrants, another of road repairs, and a third of emergency calls. If each record has a usable location, GIS can place the records in the same coordinate space. A worker can then find hydrants inside a repair zone, count calls within each fire district, or identify streets where access is blocked. The displayed map is one output of the system. The more important result may be a list of hydrants to inspect.
The five working parts of a GIS are closely connected:
- Spatial data records geometry, such as a point for a well, a line for a road, or an area for a voting district.
- Attribute data describes each feature, such as the well depth, road name, or district population.
- Software stores, edits, queries, analyzes, and displays the data.
- Methods define how data is collected, checked, combined, and interpreted.
- People decide which question to ask, what evidence is acceptable, and how the result will be used.
Location is the link. Records collected by different organizations can be compared in GIS when their locations refer to the same places in compatible coordinate systems.
A GIS can run on a desktop, a phone, a web server, or a cloud computing service. It may contain a single neighborhood survey or a national database. The scale and equipment vary, but the underlying operation stays the same: attach information to place, then examine spatial relationships.
How GIS represents a place as data
GIS represents a place by converting selected features into coordinates, geometries, attribute fields, and sometimes time stamps. The model is selective. It records facts needed for a question while leaving out detail that would add cost without improving the answer.
Two data models do most of this work. Vector data uses coordinate geometry. Points represent features too small to draw as areas at the chosen scale, such as bus stops. Lines represent connected paths, such as streams. Polygons enclose areas, such as parcels. The geometry does not dictate what a feature really is. A city can be a point on a world map and a polygon on a regional map.
Raster data divides space into a regular grid of cells. Each cell stores a value. A satellite image may store reflected energy in several wavelength bands. An elevation raster stores a height for each cell. A land cover raster may use category codes for water, forest, or built land. Smaller cells can preserve finer spatial detail, but they increase storage and processing work.
| Model | Stores | Fits well | Common limitation |
|---|---|---|---|
| Point vector | One coordinate pair per feature | Trees, stations, incidents | Does not show the feature's area |
| Line vector | Ordered coordinates forming paths | Roads, pipes, rivers | Width may be only an attribute |
| Polygon vector | Closed boundaries | Parcels, lakes, districts | Boundaries may imply false precision |
| Raster | A value in every grid cell | Imagery, elevation, temperature | Cell size limits visible detail |
The attributes usually sit in a table with one row per feature. A row for a school point might contain a school identifier, name, enrollment field, opening date, and data source. A unique identifier keeps that row attached to the correct geometry even if the name changes. Well-designed fields also state units and allowable values. A column called height is ambiguous unless its documentation says whether it means building height, ground elevation, or something else, and whether the unit is metres or feet.
A river has changing banks, depth, flow, sediment, habitats, names, and legal meanings.
A line may show the channel center, while selected fields record a name, flow class, and survey date.
The model is useful because it simplifies, but the same simplification can mislead. Anyone interpreting GIS must ask what was represented, what was omitted, how the geometry was collected, and when it was last checked.
How GIS layers work
A GIS layer groups features or cells that share a data model and meaning. Layers work together because their locations can be aligned, allowing roads, slopes, buildings, soils, and events to be compared without forcing every fact into one enormous table.
Think of a layer as a disciplined collection, not as a transparent sheet. One layer might hold road centerlines and speed limits. Another holds school polygons and capacity. A third contains a raster of flood depth estimates. Each layer has its own schema, coordinate reference system, source, and date. GIS software calculates how the layers relate in space.
Layer order changes appearance, but spatial analysis does not depend on what is visually on top. A flood polygon may be drawn beneath building points so both can be seen. An intersection operation still selects buildings whose geometries fall inside the flood polygon. Hiding a layer from the display also does not necessarily remove it from an analysis.
Layers need metadata, which is information about the data. Useful metadata names the creator, collection method, date, coordinate system, field meanings, known limits, and permission for use. Without it, a polished layer can be impossible to judge. A road file made for regional planning may omit private lanes needed by an ambulance routing system.
A school planner combines student addresses, safe crossing locations, road speed limits, and walking paths. The layers reveal which homes are near a school by straight-line distance but separated from it by a motorway or river. The planner needs the connected path network, not a circle on a map.
Layers also make updates manageable. A transport team can revise bus routes without editing the building layer. A survey team can replace old elevation cells while parcel records remain unchanged. The shared location system allows separate custodians to maintain data that can later be combined.
How spatial analysis works in GIS
Spatial analysis turns a geographic question into measurable rules applied to locations and attributes. The analyst defines inputs, performs operations such as filtering, buffering, overlay, routing, or interpolation, checks the result, and interprets it within the limits of the source data.
Replace a vague aim such as “find a good clinic site” with conditions that can be tested, including the population served, acceptable travel time, land constraints, and hazards.
Find layers that match the question's area, date, scale, and definitions. Check missing records, duplicate geometries, units, and collection methods before combining anything.
Filter parcels by size, calculate travel times along roads, exclude flood zones, and compare candidate sites with the population they would serve.
Inspect unexpected results, compare some records with trusted sources, test how changed assumptions affect rankings, and visit sites when the decision requires ground evidence.
Show the result with a map or table, but also name the criteria, data dates, uncertainty, and important factors the model did not contain.
A buffer creates an area within a specified distance of a feature. A 200 metre buffer around a stream can identify parcels that require closer review, but it does not prove pollution or legal restriction. An overlay combines geometries to find overlap. A spatial join transfers or summarizes attributes according to a location rule, such as counting crash points within each road district.
Network analysis treats roads, rails, pipes, or paths as connected edges and junctions. A shortest route may minimize distance, time, cost, or another weight. If road segment A is 2 kilometres at 40 kilometres per hour, its ideal travel time is computed, not guessed.
The segment takes 3 minutes under the assumed constant speed. Junction delay, traffic, and access rules would need separate data.
Interpolation estimates values between measured points. Weather stations, for example, measure conditions at specific locations. An interpolation method uses those measurements and stated assumptions to estimate a continuous surface. The empty space is not newly observed. It is modeled, and confidence usually falls where stations are sparse or physical barriers complicate the pattern.
GIS versus a digital map
A digital map presents selected geographic information, while GIS stores structured spatial data and provides tools to query, edit, combine, and analyze it. A map can be the visible product of GIS, but the underlying database and operations are what make GIS a system.
A phone map that displays cafés and directions may be powered by GIS, but looking at it does not give the viewer full GIS functions. A GIS analyst can ask for all cafés within a walking network distance of a station, join inspection records to them, group results by district, and save the process for new data. The distinction is capability, not screen appearance.
Communicates a chosen view. It may let a user zoom, search, or switch visible categories while keeping the analysis fixed.
Lets a user inspect records, change assumptions, create new geometries, run spatial operations, test data quality, and produce multiple outputs.
Map design still matters. Symbols, labels, color, scale, and classification affect what a person sees. The principles behind designing maps that communicate clearly help prevent an accurate analysis from becoming a confusing or biased display. GIS supplies analytical power, while cartography shapes the final message.
A spreadsheet is another nearby tool, and it remains useful. It can filter rows, calculate fields, and make charts. GIS adds geometry and spatial relationships. A spreadsheet can compare two address strings, but GIS can geocode those addresses into coordinates and calculate which service area contains them. Geocoding itself can fail when an address is incomplete, duplicated, new, or matched to the wrong street, so its results need checking.
How coordinate systems and scale affect GIS answers
Coordinate systems define how stored numbers correspond to positions on Earth, while scale and resolution define the level of detail the data can support. If these properties are mismatched or misunderstood, aligned layers can shift, distances can distort, and precise-looking answers can be wrong.
Latitude and longitude describe positions on a curved reference surface. They are angular coordinates, usually expressed in degrees. A map projection converts locations from that curved surface to a flat coordinate grid. Every projection distorts some combination of area, shape, distance, or direction. A projection suitable for comparing country areas may not be the right one for engineering measurements in a town.
A coordinate reference system includes more than a projection name. It also specifies the reference model for Earth, coordinate axes, units, and other parameters needed to interpret the numbers. Software can transform a layer into another system when the original system is correctly identified. Assigning the wrong system label does not repair coordinates. It misdescribes them.
Displayed precision is not measured accuracy. Coordinates with many decimal places may still come from an old, approximate, or poorly matched source. Extra digits do not improve the observation.
Scale concerns the relationship between a representation and the ground. A boundary digitized for a small-scale national map should not be treated as a surveyed property line. Raster resolution is often described by cell size. If each elevation cell covers a square 30 metres on each side, then each value summarizes or represents an area of 900 square metres.
A smaller object can influence the recorded value, but the grid cannot preserve its exact shape as a separate cell pattern.
Scale also changes patterns. A cluster visible by street may disappear when values are averaged by county. Conversely, a county average can hide sharply different neighborhoods. This is not a software error. It is a consequence of grouping observations into different spatial units.
How GIS shows up in real work and daily decisions
GIS appears wherever people allocate resources, monitor change, manage networks, respond to hazards, or explain patterns across space. The same basic operations support emergency response, conservation, business planning, public health, utilities, transport, journalism, and ordinary location searches.
Emergency teams turn reports into an operating picture
Emergency GIS combines incident reports, road closures, terrain, buildings, weather observations, and resource locations. Dispatchers may use network routes to send crews around closures. Planners may overlay an evacuation zone with address points to estimate which records require notification. Field teams update conditions, and the shared map gives different groups a common spatial reference.
The data has to be timely. Yesterday's open bridge or last year's building list can create a dangerous result. Good emergency mapping marks when each layer was updated and distinguishes observed facts from modeled forecasts.
Public health teams compare cases with populations
Case locations can reveal clusters, but raw dots are rarely enough. Ten cases in a densely populated district can mean something different from ten cases in a small settlement. Analysts calculate rates using an appropriate population denominator, protect personal information, and test whether an apparent cluster could reflect reporting practices or access to care.
Privacy matters because location can identify a person even after a name is removed. Public maps may aggregate records into larger areas, suppress small counts, or show a generalized surface. Those choices reduce disclosure risk, but they also reduce detail. The tradeoff should be stated.
Utilities maintain connected systems
Water, electricity, gas, and telecommunications organizations use GIS to record assets and network connections. A pipe is not only a line on a screen. Its record may include diameter, material, installation date, inspection history, and the valves that isolate it. When a break occurs, network tracing can help identify which valves to close and which customers may lose service.
Field crews can collect coordinates, photographs, and condition notes on site. Office staff then check those updates before changing the authoritative database. This controlled process prevents one mistaken tap or uncertain location from silently replacing a trusted record.
Environmental scientists measure change across space
Scientists combine field samples with elevation, waterways, land cover, and imagery to study erosion, habitat, fire, flooding, or pollution. The imagery often begins with satellite and airborne measurements of reflected or emitted energy. GIS aligns those observations with boundaries and field records so researchers can calculate change within a study area.
A detected color change is not automatically deforestation, crop stress, or polluted water. The analyst must consider cloud, season, sensor properties, shadows, and ground verification. GIS organizes the evidence, but it does not remove the need for scientific judgment.
Businesses and governments test access rather than simple closeness
A shop, clinic, library, or polling place serves people through a transport network. GIS can estimate travel time along roads and paths, include barriers and opening hours, and compare access among population groups. Straight-line distance may be a useful first screen, but it ignores bridges, turns, slopes, schedules, and restricted entrances.
A rental listing says a flat is close to a railway station. A route map shows the entrance is on the far side of the tracks and the only crossing is several streets away. GIS explains the difference between being near in geometric distance and being accessible through a network.
Navigation apps also use GIS databases, traffic observations, and positioning. The receiver location commonly comes from satellite ranging and GPS position calculation, while GIS supplies the road network, addresses, restrictions, and route logic. GPS estimates where the device is. GIS relates that position to the rest of the mapped world.
4 mistakes people make with GIS
Most serious GIS mistakes come from treating data or outputs as more complete, current, accurate, or neutral than they are. Four common errors are trusting appearance, combining incompatible evidence, confusing association with cause, and hiding human choices inside an automated result.
1. Assuming a polished map is accurate
Clean symbols and detailed basemaps can make weak data look authoritative. The visual quality of the display says nothing about how coordinates were collected or how old the records are. Check the source, date, scale, definitions, missing values, and known errors before using the result.
2. Combining layers that answer different questions
Two files can align on screen yet remain conceptually incompatible. One population layer may count usual residents, while another records people present during the day. A wetland boundary interpreted from imagery may not equal a legal wetland boundary. Before overlaying layers, compare their dates, definitions, collection scales, and intended uses.
3. Treating a spatial pattern as a cause
Nearby events may share a cause, influence each other, or simply occur near the same population or reporting system. A map showing illness near a factory does not by itself prove exposure from that factory. A sound investigation considers time, pathways, background rates, alternative explanations, and nonspatial evidence.
Spatial correlation can still be useful. It can identify a hypothesis, focus sampling, or show where a policy has unequal effects. The mistake is moving from pattern to explanation without testing the mechanism.
4. Treating model settings as neutral facts
A buffer distance, travel speed, classification break, suitability weight, or definition of access is a human choice. Different defensible choices can produce different outputs. Analysts should record settings, test alternatives, and explain which groups gain or lose under a decision rule.
Imagine a site model that scores flood safety and road access equally. If flood safety receives twice the weight instead, the winning site may change. GIS performs the arithmetic consistently, but it cannot decide what society should value. That remains a policy judgment supported by evidence.
Does GIS need satellites, GPS, or the internet?
GIS does not require satellites, GPS, or an internet connection. Those technologies can supply imagery, coordinates, basemaps, or shared services, but GIS can also analyze surveyed paper records, locally stored files, hand-digitized features, and field observations on an offline computer.
The tools are related but distinct. Remote sensing measures characteristics at a distance, often producing raster data. GPS and other satellite navigation systems estimate a receiver's position and time. GIS stores and analyzes those outputs alongside many other sources. A historical GIS project might digitize property boundaries from scanned nineteenth-century maps and connect them to census records without using GPS for the original observations.
The internet changes how data and computation are shared. A web GIS may request map tiles, query a remote database, or send an analysis to a server. An offline GIS keeps the relevant data and software on the device. Offline work is common where connectivity is weak, data is sensitive, or field teams need dependable access. Synchronization can happen later, with conflicts reviewed rather than blindly overwritten.
A phone can use all three at once. Its GPS estimate places the phone, remotely sensed imagery provides a background, and GIS finds nearby features or calculates a route. Keeping the roles separate makes errors easier to diagnose. A wrong blue dot, an old image, and a missing road come from different parts of the system.
Can GIS predict what happens next?
GIS can support forecasts by adding location to statistical, physical, or simulation models, but it does not predict the future by itself. A forecast is conditional on input data, model assumptions, and changing human or environmental processes, so uncertainty belongs in the result.
A flood model can combine predicted rainfall, terrain, soil, drainage, and river conditions to estimate where water may move. GIS manages the input surfaces and maps the model output. If a drain is blocked, a levee fails, or rain falls somewhere unexpected, the observed flood can differ. A probability or scenario map should never be read as a guaranteed boundary.
Prediction also differs from suitability analysis. A suitability map identifies places that satisfy chosen criteria, such as gentle slope, road access, and distance from protected habitat. It does not prove that development will occur there. People, prices, law, ownership, and politics can alter the outcome.
Useful forecasts show more than a single best estimate. They may compare scenarios, map ranges, or mark areas where evidence is weak. Decision-makers can then ask what action is reasonable if the forecast is slightly wrong, and which new observation would reduce uncertainty most.
GIS turns geography into testable decisions
GIS gives geography an operational language: location becomes coordinates, features become data, relationships become measurable rules, and claims can be checked against mapped evidence. Its value depends on keeping the real place, the simplified model, and the final decision clearly separate.
Geography studies how physical processes, human activity, distance, connection, and scale shape places. GIS does not replace that knowledge. It gives geographers a way to organize observations and test spatial explanations. A flood exposure map needs hydrology and settlement geography. A transport access map needs network structure and an account of who can use each route. You can see how geographic ideas connect across the subject by noticing how often location changes the meaning of evidence.
The next time you see a map used to justify a decision, inspect it as the visible end of a longer chain. Ask what each feature represents, who collected it, which date it describes, which coordinate system and scale support it, what operation produced the pattern, and what evidence was left outside the database.
The takeaway: GIS is a method for reasoning with located data, not a machine for making location-based claims automatically true. A trustworthy result keeps its sources, assumptions, spatial operations, uncertainty, and purpose visible.