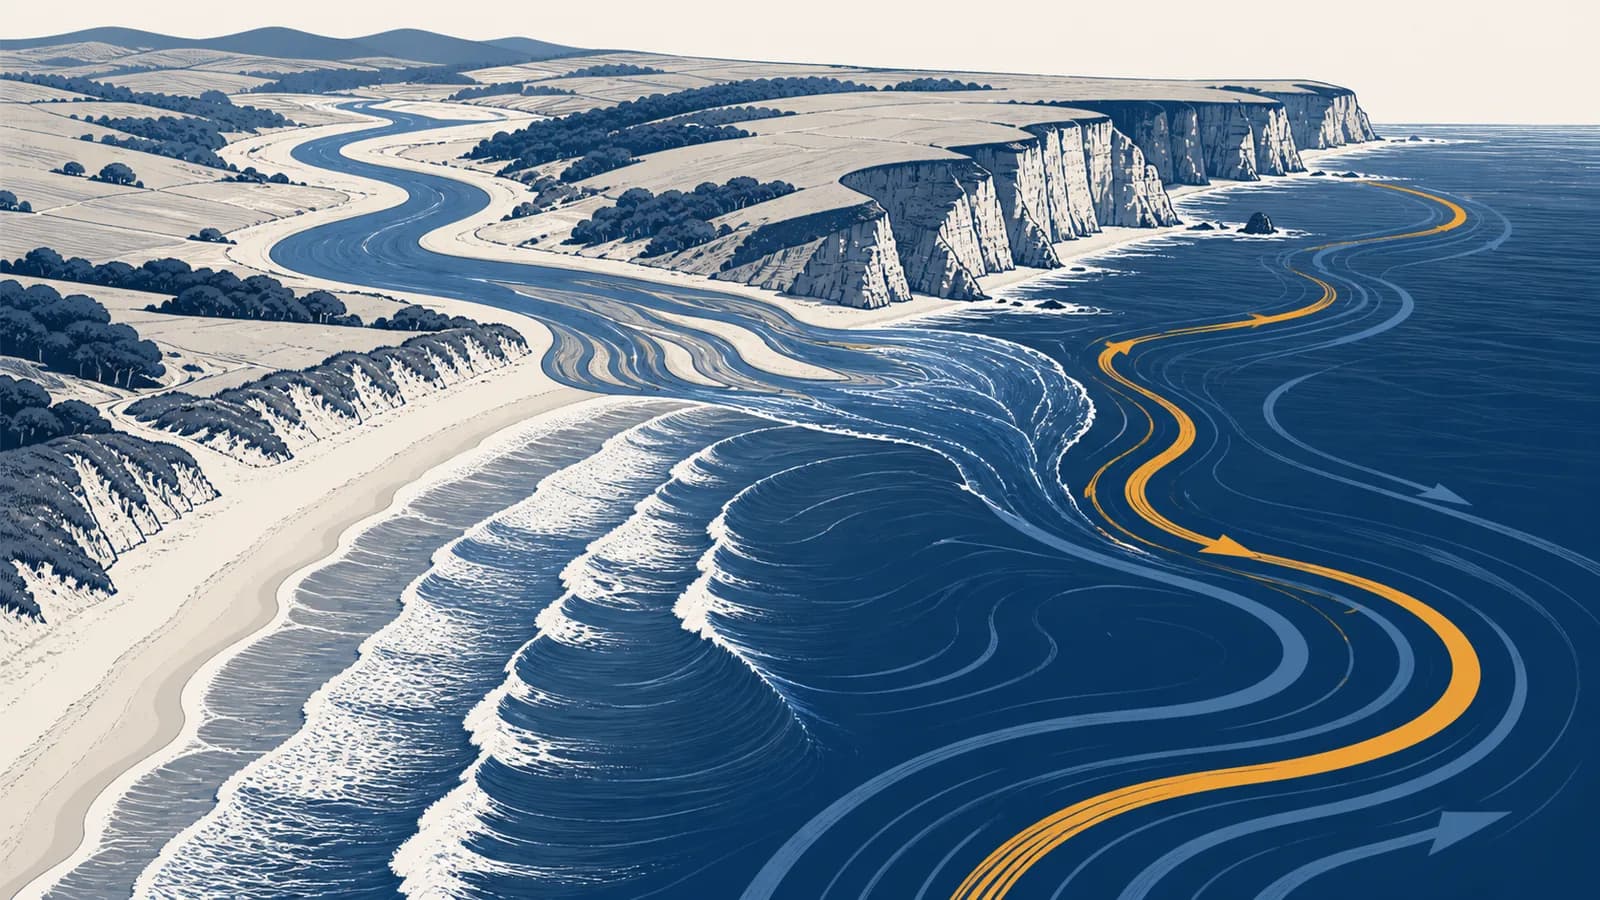
Oceans and coastal geography is a branch of physical geography that explains how ocean water, waves, tides, currents, rock, sediment, and people shape the edges of continents, in the context of Earth’s connected surface systems. Ocean geography and coastal geography exist as fields of study because the boundary between land and sea moves, carries energy, creates landforms, supports ecosystems, and concentrates human activity. Terms such as ocean currents, coastal erosion, longshore drift, beaches, cliffs, estuaries, and sea level describe parts of one linked system rather than a collection of isolated facts.
A coastline looks like a line on a map, but on the ground it is a shifting zone. Water rises and falls across it. Storm waves remove sand in hours. Rivers deliver sediment over centuries. Harbours interrupt that movement, while homes and roads turn natural change into financial risk. Coastal geographers ask where each process operates, how quickly it acts, and what changes when one part of the system is altered.
What an ocean basin actually is
An ocean basin is a large depression in Earth’s crust that holds seawater and includes continental margins, deep plains, ridges, trenches, and underwater volcanoes. Its shape controls water depth, routes currents, stores sediment, and links plate tectonics with the geography visible at the surface.
Earth has one connected global ocean, conventionally divided into the Pacific, Atlantic, Indian, Southern, and Arctic oceans. Those names help people describe location, but water can pass between the divisions. A current that begins in one named ocean can transport heat, salt, nutrients, organisms, and floating material into another.
The edge of a basin is not simply the visible shore. Most continents continue underwater as a relatively shallow continental shelf. Farther out, the seabed descends along the continental slope toward the deep ocean floor. Sediment carried by rivers or eroded from cliffs can cross the shelf, descend submarine canyons, and settle in deeper water.
The basin floor records plate movement. New oceanic crust forms along mid ocean ridges where plates separate. Old oceanic crust can descend into the mantle at a subduction zone, often marked by a deep trench. These processes explain why some continental edges face wide shelves and broad coastal plains, while others face narrow shelves, steep mountains, earthquakes, and volcanic arcs. The wider study of how relief and landforms develop connects the hidden seabed to the visible continent.
How ocean water moves
Ocean water moves through wind driven surface currents, density driven circulation, tides, and waves. Each motion has a different immediate cause, but coastlines, basin shape, Earth’s rotation, water depth, temperature, and salinity redirect the flow and determine its effects in a particular place.
Wind transfers energy to the sea surface through friction. Persistent global winds push broad surface currents. Earth rotates beneath the moving water, so the Coriolis effect deflects its path to the right in the Northern Hemisphere and to the left in the Southern Hemisphere. Continents then block and turn the flow, helping create large rotating current systems called gyres.
Surface currents move heat as well as water. A warm current can raise the temperature of air passing over it. A cold current can cool the lower atmosphere, reduce evaporation, or help fog form when moist air crosses cold water. The result depends on wind direction and local relief, so a current does not set coastal climate by itself. The mechanisms behind pressure, wind, clouds, and rainfall are developed further in the guide to climate systems and weather patterns.
Deep circulation begins with density differences. Seawater generally becomes denser as it cools, and adding dissolved salt also increases density. Cold, salty water can sink, spread through deep basins, and later return toward the surface. This overturning circulation is slow and complex. It is driven by linked changes in heat, freshwater, wind, and mixing, not by a single underwater conveyor belt moving at one fixed speed.
Ocean currents are rivers in the sea with rigid banks and one permanent route.
Currents are broad moving bodies of water whose speed, width, depth, and route can vary as winds, density, seasons, and nearby currents change.
How waves reshape a coast
Waves reshape a coast by transferring wind energy into shallow water, where friction slows the wave, shortens its wavelength, increases its height, and eventually makes it break. Breaking water erodes exposed material, transports sediment, and deposits it where energy falls.
Wind creates most ordinary sea waves. The size of a wave depends on wind speed, how long the wind blows, and the fetch, which is the uninterrupted distance across water over which it blows. The water itself mostly moves in circular orbits as a wave passes. Energy travels forward much farther than an individual water particle.
The seabed interferes with orbital water motion beneath the wave.
Its period stays nearly constant, so the distance between crests becomes shorter.
The crest continues moving faster than the base until the wave becomes unstable.
Water rushes up the beach as swash, then returns downslope as backwash.
In water that is shallow compared with the wavelength, a useful approximation relates wave speed to depth:
With gravitational acceleration and depth , .
That relation explains why a tsunami slows and grows taller as it enters shallower coastal water, though predicting an actual tsunami also requires seabed shape, wave direction, and shoreline form. It also explains refraction. The part of an ordinary wave that reaches shallow water first slows first, turning the crest toward the coast. Refraction can concentrate wave energy on headlands and spread it through bays.
Waves erode by several mechanisms. Hydraulic action forces water and compressed air into cracks. Abrasion occurs when sand and stones strike the coast. Attrition rounds and reduces sediment as pieces collide. Solution removes rock that dissolves in seawater. The strength and joint pattern of the rock, beach cover, wave exposure, and storm frequency all affect the rate.
What coastal landforms actually are
Coastal landforms are physical features produced where marine processes interact with geology, sediment, rivers, organisms, wind, and changing sea level. Cliffs, caves, arches, stacks, beaches, spits, bars, dunes, mudflats, salt marshes, deltas, and estuaries each record a different balance.
On a resistant rocky coast, waves often exploit joints or faults in a headland. A crack enlarges into a cave. Continued erosion may cut through the headland to form an arch. If the roof collapses, an isolated pillar called a stack remains. Later erosion can reduce it to a stump. This is a useful sequence, but not every cave becomes an arch, and real coasts do not progress through identical stages on schedule.
| Landform | Main setting | Process that maintains or changes it |
|---|---|---|
| Cliff and wave cut platform | Exposed, resistant coast | Wave attack undercuts the cliff; collapse and removal allow retreat |
| Beach | Shore with a sediment supply | Swash, backwash, currents, storms, and wind sort and move material |
| Spit | Where a coast changes direction or crosses an estuary mouth | Longshore transport extends a narrow ridge into open water |
| Delta | River mouth where sediment accumulates | River deposition builds land while waves, tides, and subsidence rework it |
| Estuary | Drowned lower river valley influenced by tides | Freshwater and seawater mix; tidal currents move fine sediment |
Depositional landforms need a sediment budget. Sources include rivers, eroding cliffs, offshore deposits, shells, and material moved alongshore. Stores include beaches, dunes, bars, tidal flats, and nearshore seabeds. Sediment leaves when waves or currents carry it into deep water, wind blows it inland, or people remove it. A beach can therefore narrow even if waves still deposit sand on calm days, because more sediment leaves over a year than arrives.
A beach is a moving sediment store. Its summer and winter profiles can differ because calmer waves tend to build the upper beach, while storm waves often move sand offshore into bars.
Biology also builds coasts. Corals construct reef frameworks in warm, shallow, sunlit water when other conditions permit. Mangrove roots and salt marsh plants slow water and trap fine sediment. Dunes form when dry beach sand blows inland and vegetation catches it. These landforms are physical features and living habitats at the same time. Their links to food webs and environmental zones appear in how ecosystems and biomes are organised.
Erosion versus deposition
Erosion removes material from a coast, while deposition places transported material where water or wind loses the energy needed to carry it. They are opposite transfers within the same sediment system, so both can occur along one beach during different waves, tides, or seasons.
The distinction becomes clearer by following one grain of sand. A breaking wave may lift it from the lower beach, a current may carry it sideways, and weaker water may drop it inside a sheltered bay. The first location experiences erosion; the final location experiences deposition. The grain has not vanished or appeared. Its position changed.
Material is detached and removed. High energy waves, exposed headlands, steep beach profiles, soft rock, and limited protective sediment can favour it.
Transported material settles. Lower energy water, sheltered bays, gentle gradients, obstacles, and abundant sediment can favour it.
Longshore drift links the two. When waves approach a beach at an angle, swash carries sediment up and along the beach. Gravity pulls backwash more directly downslope. Repeated motion produces a net movement along the shore. Coastal currents can add to this transport. The dominant direction can reverse during unusual winds or storms, so field evidence is better than assuming one permanent direction.
A harbour wall interrupts alongshore sediment transport. Sand accumulates on the updrift side, making that beach wider. Less sand reaches the downdrift coast, so its beach may narrow and expose cliffs or property to stronger wave attack. Protecting one site has shifted the sediment budget rather than stopping the coastal system.
Geographers measure change with repeated beach profiles, fixed photographs, sediment size samples, aerial images, satellite data, and position surveys. A single photograph after a storm shows a condition, not a trend. A trend requires comparable observations over time and attention to tide level, season, survey method, and short term recovery.
How tides work
Tides are long period rises and falls of sea level caused mainly by the Moon’s gravity, with the Sun’s gravity and the motion of the Earth Moon system modifying the pattern. Coast shape, seabed depth, and basin resonance determine local timing and range.
The Moon pulls more strongly on the side of Earth nearer to it than on Earth’s centre, and more strongly on the centre than on the far side. This difference in gravitational pull helps produce two broad tidal bulges. As Earth rotates relative to them, many coasts pass through two high and two low tides during a lunar day. Local geography can produce one dominant daily cycle or a mixed pattern instead.
When the Sun, Moon, and Earth align near new moon or full moon, their tide producing effects reinforce one another. The result is a spring tide, meaning a relatively large tidal range. Near first and third quarter moon, the effects partly oppose one another, producing a neap tide with a smaller range. The names do not refer to the seasons.
Tide tables predict astronomical tides for named locations, but observed water level can differ. Low atmospheric pressure allows sea level to rise, strong onshore wind piles water toward land, and river discharge adds water near an estuary. A storm surge that arrives near high tide can therefore reach farther inland than either the predicted tide or surge would alone.
Tide time is location specific. The high tide time for one harbour cannot safely be copied to a beach around the headland, especially where sandbanks, channels, and narrow inlets delay the tidal wave.
How coastal geography shows up in maps, forecasts, and planning
Coastal geography becomes practical when people combine elevation, bathymetry, waves, tides, sediment movement, ecosystems, and human assets to decide where water may go and what may be damaged. The same evidence guides navigation, weather warnings, construction, habitat management, and emergency evacuation.
A nautical chart shows water depth, hazards, navigation marks, channels, and tidal information. A topographic map shows land elevation and slope. Neither alone describes flood exposure. Planners combine them with tide records, storm scenarios, drainage routes, barriers, building locations, and populations that may need help leaving.
A harbour manager sees an onshore storm forecast for the same hours as a high astronomical tide. The relevant question is not simply how much rain will fall. Wind direction, wave height, predicted tide, low pressure, harbour shape, and the height of quays determine whether vessels need extra lines and whether movable flood gates should close.
Engineers need coastal process data before placing a seawall, breakwater, groyne, bridge, outfall, or wind turbine cable. Fishers and port pilots use currents and tide windows. Insurers and mortgage lenders assess flood and erosion exposure. Rescue teams study rip currents, access points, and the way a rising tide can cut off a return route. Residents use the same knowledge when deciding where to walk, build, or park.
Map scale matters. A global sea level projection cannot show which street floods first. A detailed elevation model may show low ground but miss a blocked drain or a newly raised wall. Good coastal decisions join broad processes to local measurements, then state uncertainty rather than hiding it.
How human decisions alter coasts
Human decisions alter coasts by changing sediment supply, wave energy, water flow, habitats, and the value placed in exposed locations. Dams, dredging, sand mining, ports, sea defences, wetland drainage, and building construction can move a problem rather than remove it.
A dam can trap river sediment that would otherwise replenish a delta or beach. Dredging keeps a shipping channel deep but relocates seabed material. A seawall may protect buildings directly behind it while reflected wave energy and the loss of an upper beach contribute to narrowing nearby. Results vary with design and setting, so no structure has one universal effect.
Coastal management choices fall into several broad approaches:
- Hold the line: maintain or build defences near the present shoreline.
- Advance the line: create defended land seaward, often through reclamation.
- Managed realignment: move defences inland and allow selected low areas to flood, sometimes creating salt marsh that absorbs wave energy.
- No active intervention: stop maintaining defences and allow natural processes to continue, while managing safety and transition.
Choosing among them is a geographic decision because benefits and costs occur in different places and times. A wall can protect a road now but squeeze out an intertidal habitat as sea level rises. Realignment can reduce long term defence costs but require farmland or buildings to change use. Decision makers compare engineering limits, land ownership, heritage, ecosystems, public access, maintenance, and who bears residual risk.
This sentence is a principle, not a universal verdict against engineering. Some locations need strong structures. Others have room for dunes, reefs, beaches, or wetlands to reduce wave energy. Many use a combination. The geographic task is to define the system boundary widely enough that a local success does not conceal a downdrift loss.
Four mistakes people make with coastal change
Most errors in coastal geography come from treating a moving system as fixed, confusing a short event with a long trend, or examining one place without its sediment sources and neighbours. Four mistakes repeatedly produce weak explanations and poor decisions.
1. A coastline is treated as a permanent boundary
A mapped coastline represents a chosen water level, survey date, and scale. Tides move the waterline each day, storms rearrange beaches, and cliffs retreat through irregular collapses. Two accurate maps can show different lines because they used different definitions or dates. Always check what the line represents.
2. Every eroding beach is assumed to be losing sand forever
A storm can move sand from the visible upper beach to an offshore bar, then gentler waves can return some of it. This seasonal or event scale exchange differs from a persistent negative sediment budget. Repeated profiles and offshore measurements help distinguish temporary redistribution from long term loss.
3. Sea level rise is described as the ocean rising equally everywhere
Global mean sea level is an average. Relative sea level at a coast also depends on vertical land movement, currents, atmospheric pressure, gravity, and regional ocean behaviour. Land subsidence can worsen local change; land uplift can offset part of it. Flood impacts then depend on waves, tides, barriers, and elevation.
4. A defence is judged only at the property behind it
A barrier may meet its local aim while changing erosion, flooding, access, or habitat elsewhere. Evaluation should follow sediment and water across adjacent shoreline sections, compare conditions before and after construction, and include maintenance. The correct scale is the connected coastal cell, estuary, or flood basin.
What salinity changes in the ocean
Salinity is the amount of dissolved material in seawater, and it changes water density, freezing behaviour, marine habitats, and circulation. It rises where evaporation or sea ice formation removes freshwater, and falls where rain, rivers, melting ice, or groundwater add freshwater.
Typical open ocean seawater contains roughly 35 grams of dissolved salts per kilogram of seawater, often expressed as a salinity near 35. It is not equally salty everywhere. Enclosed dry region seas may become saltier through strong evaporation, while rainy equatorial waters, river mouths, and melting ice zones can be fresher.
An estuary contains a moving salinity gradient. River water flows seaward near the surface, denser seawater may push inland below it, and tides stir the layers. The pattern can change between flood and ebb tide or after heavy rain. Organisms living there must tolerate variation that open ocean species may not.
How sea level and storm surge differ
Sea level describes the average height of the ocean over a stated period and reference surface, while storm surge is a temporary rise above the predicted astronomical tide caused mainly by wind and atmospheric pressure. Waves ride on both and can reach farther inland.
Sea level changes across several timescales. Tides act over hours. Weather effects act over hours or days. Seasonal heating, winds, and water storage shift regional levels over months. Long term global mean change reflects added ocean water and expansion as seawater warms, while local land uplift or subsidence modifies the relative change measured at a coast.
A weather driven departure from the expected tide, usually lasting hours to days and varying sharply by coast shape and storm track.
A shift in average level measured over enough time to separate the trend from tides, waves, seasons, and short weather events.
Flood depth is not found by adding one global number to every map. A local assessment needs land elevation tied to the same vertical reference as the water level, plus waves, surge, tide, river flow, drainage, barriers, and possible failure routes. Small height differences can matter greatly across flat land.
How rip currents form and how to respond
A rip current is a narrow, fast seaward flow that returns water carried toward the beach by breaking waves. It often forms through a deeper gap in a sandbar or beside a structure, and it can carry a swimmer away from shore without pulling them underwater.
Breaking waves raise water level near the beach. That water must flow back offshore. If a sandbar blocks the direct return, water travels alongshore until it finds a deeper channel, then accelerates seaward through the gap. The current may look like darker or choppier water, a break in the line of breaking waves, or a plume of foam moving offshore, but signs are not always obvious.
Do not fight directly against a rip current. Follow local beach safety advice, signal for help, conserve energy, and if able move parallel to the shore to leave the narrow current before returning at an angle. Swim at a lifeguarded beach when possible.
A rip current is different from a tide, although tide level can change where and how strongly it flows. It is also different from undertow, the near bed return flow beneath breaking waves. Precise safety advice can vary by location and conditions, so posted warnings and lifeguards take priority over a general diagram.
Oceans make physical geography one connected system
Oceans connect the major parts of physical geography by storing and moving heat, receiving river sediment, shaping landforms, supporting ecosystems, and changing the boundary between land and water. A useful coastal explanation therefore follows energy, water, and sediment across space and time.
The next time you see a beach, cliff, harbour, or estuary, identify the energy source first. Look for the direction of incoming waves, sheltered and exposed sections, sediment size, evidence of recent high water, and structures that interrupt flow. Then ask where the water and sediment came from, where they are going, and what timescale the evidence represents.
That habit turns a view into a geographic investigation. It also shows why coastlines cannot be understood apart from weather, rivers, geology, ecosystems, and human land use. You can place those connections within the wider set of geography explanations, where physical processes and human decisions meet across many kinds of place.
The takeaway: A coast is a transfer zone, not a fixed line. Explain it by tracking the forces that move water, the energy that moves sediment, the landforms that store it, and the decisions that alter those transfers.