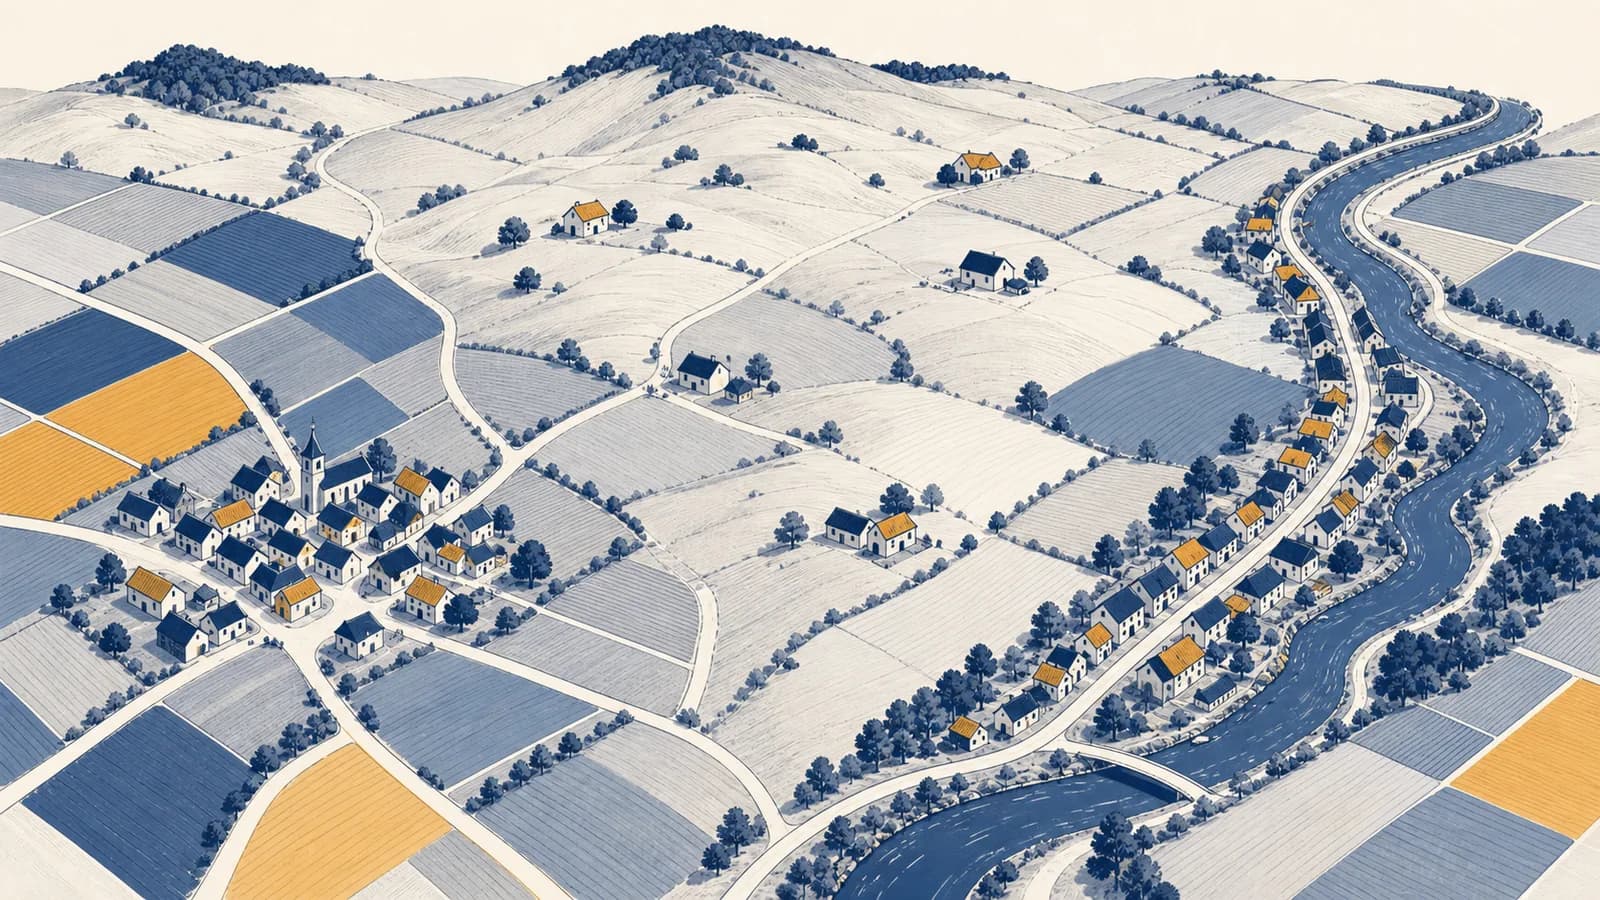
A settlement pattern is a spatial arrangement that shows how homes, buildings, and communities are positioned in relation to one another, in the context of human geography. The main types of settlement patterns are nucleated or clustered, dispersed, and linear. Geographers study settlement patterns to explain why people build in particular places and how that arrangement affects roads, services, land use, and daily life. A pattern exists because households respond to shared conditions such as water, transport, work, safety, land ownership, and relief.
Look at a map of almost any inhabited area. Some buildings bunch around a road junction. Others form a thin ribbon beside a river. Farmhouses may stand far apart across fields. These arrangements are evidence. They record decisions made by households, landowners, businesses, governments, and earlier generations.
What a settlement pattern actually is
A settlement pattern is the visible arrangement of occupied places across space. It describes the spacing and shape of buildings or settlements, while also giving geographers clues about the physical conditions and human decisions that produced that arrangement.
A settlement is a place where people live, ranging from an isolated dwelling to a hamlet, village, town, or city. A pattern appears when the positions of several dwellings or settlements are considered together. One house does not establish a pattern. Ten houses mapped across a valley may.
Scale changes what the term means. On a local map, a geographer might examine the arrangement of buildings inside one village. On a regional map, each dot might represent an entire town. The same area can look clustered at one scale and dispersed at another. A compact village may sit within a region of widely separated villages.
Pattern is not cause. A map shows where settlement occurred. Field evidence, records, interviews, and other maps are needed to explain why it occurred there.
Settlement site and situation help connect arrangement to cause. Site means the characteristics of the ground occupied by a settlement, such as slope, drainage, soil, and access to water. Situation means the settlement's position relative to other places, such as a bridge, market, port, mine, or road network.
How geographers identify a settlement pattern
Geographers identify a settlement pattern by choosing a scale, mapping occupied buildings or places, and comparing their spacing and alignment. They then test possible explanations against physical features, transport routes, land boundaries, historical evidence, and observations on the ground.
Decide whether each mapped point represents a building, a household, a village, or a town. A conclusion is meaningful only if every point represents the same kind of thing.
Use a map, aerial image, geographic information system, or field survey. Mark occupied structures rather than every roof, unless the question concerns all buildings.
Ask whether points bunch, spread, or follow a line. Measure distances if the visual result is uncertain.
Compare the points with contours, rivers, roads, flood zones, field boundaries, workplaces, and public services. A repeated spatial relationship can support an explanation.
Look for exceptions and alternative causes. Buildings beside a road may predate it, and a straight line of houses may follow a property boundary rather than a transport route.
The basic visual classification is useful, but measurements can make it more consistent. One method compares the average distance from each point to its nearest neighbour with the distance expected if the same number of points were randomly scattered through the same area.
Hypothetical example: 100 homes occupy 25 square kilometres, so density is 4 per square kilometre and the expected random distance is 0.25 km. If the observed mean is 0.15 km, , which indicates clustering.
A ratio near zero signals strong clustering, a value near one is consistent with a random arrangement, and values above one indicate increasing regularity. The number does not reveal the cause. It can also be distorted by an oddly shaped study boundary, barriers inside the area, or points concentrated near its edge.
How nucleated settlements work
A nucleated settlement concentrates buildings around a central feature or within a compact built area. Short distances between households can improve access to shared facilities, while leaving larger blocks of land outside the settlement available for farming, grazing, or conservation.
The nucleus may be a crossroads, market square, defensive site, well, religious building, factory, station, or harbour. Once a small centre forms, later buildings often attach to it because the centre already has paths, customers, services, and social connections. This produces a feedback process.
Clustering has costs as well as benefits. Land near the centre may become expensive. Noise and congestion can rise. Waste and dirty water become concentrated if infrastructure is weak. Fire can spread more easily between close buildings. A compact pattern therefore changes which public systems are needed, rather than automatically producing a good or bad place.
A cooperative grain mill is built where two roads meet. Farmers travel to the mill, a repair shop opens beside it, and workers seek homes within walking distance. The original junction did not force a village to appear, but shared access made nearby sites more useful than isolated ones.
Nucleated does not mean circular or perfectly dense. A cluster can be irregular, and open land may remain inside it. The defining feature is relative concentration compared with the surrounding area.
How dispersed settlements work
A dispersed settlement spreads individual homes, farms, or small groups of buildings across a wide area. It commonly develops where households need direct access to separate parcels of land, can provide some services privately, and are not strongly pulled toward one centre.
Farming can produce dispersion because living beside fields, animals, or equipment reduces daily travel. Large landholdings create greater distances between homes. Rough terrain may divide usable ground into separate pockets. In other places, planned low density housing, private vehicles, reliable communications, or a preference for space can support a dispersed arrangement.
Distance changes the cost of networks. A water pipe, electric cable, school route, postal round, or ambulance trip must cover more ground to reach the same number of households. Some residents use wells, septic systems, stored fuel, or private vehicles because a shared network would be costly to extend.
People live far apart simply because the area has few people.
Low population may contribute, but property size, farm work, terrain, planning rules, roads, and service technology can all shape the spacing. Population totals alone do not explain the arrangement.
Dispersion can also be planned. A government may allocate regular rural plots, a company may build staff housing beside separate work sites, or planning law may require large lots. This is why regular spacing deserves attention. Natural opportunities rarely create perfectly even intervals without some rule, survey, or repeated economic calculation.
How linear settlements work
A linear settlement arranges buildings in a line or narrow ribbon, usually along a route or physical edge. Each site gains access to the same road, river, canal, coast, valley floor, or ridge while avoiding less usable land nearby.
Linear growth begins when one long feature offers access. Houses may face a road while narrow plots extend behind them. Buildings beside a river may use water, transport, fertile soils, or a flat terrace above floods. In steep country, the valley floor may provide the only practical strip for construction.
A line can lengthen without developing a strong centre. This makes movement along the main route easy, but movement across the settlement difficult. Traffic must often use the same corridor. Utilities can follow that corridor efficiently, although reaching buildings beyond the ends becomes increasingly expensive.
Ribbon development along roads can blur the boundary between neighbouring settlements. It can also create many driveways and junctions on a through route. Planners may restrict further roadside building to protect traffic flow, farmland, or a clear gap between towns.
Settlement pattern versus population distribution and density
Settlement pattern describes the arrangement and shape of occupied places, while population distribution describes where people are located and population density measures how many people occupy a stated area. The ideas overlap, but none can safely substitute for the others.
Density is calculated by dividing a population by an area. Two districts can have the same density and very different patterns. Suppose each district contains 1,000 people in 100 square kilometres. Both have an arithmetic density of 10 people per square kilometre. In one, nearly everyone may occupy one compact town. In the other, households may be spread across the whole district.
The result is identical for both hypothetical districts, even though their settlement arrangements are different.
Distribution adds location to the total. Density compresses the information into one average. Pattern focuses attention on relative position, spacing, and form. The distinctions are developed further in the guide to how population distribution and density are measured.
How physical and human factors combine
Settlement patterns emerge from interacting physical and human factors, not from a single universal rule. Water, relief, soils, hazards, and climate affect what sites can support, while work, transport, ownership, politics, culture, technology, and planning affect which sites people choose.
Physical conditions alter costs and risks. Flat ground usually makes building and road construction simpler than a steep slope. Reliable water supports households and production. Floodplains may offer fertile soil and level routes while also exposing buildings to floods. A sheltered harbour can favour concentration, while scattered patches of fertile land can favour dispersion.
Human systems decide how those conditions are used. A railway station can create a new nucleus. Land inheritance can split farms into narrow strips or preserve large estates. Defensive needs can push homes together. A zoning rule can block construction outside a defined boundary. A bridge can redirect movement away from an older ford.
| Factor | Spatial mechanism | Pattern it may encourage |
|---|---|---|
| One reliable well | Many households need access to the same point | Nucleated |
| Separate large farms | Households live near their own working land | Dispersed |
| Narrow valley floor | Buildable ground follows one strip | Linear |
| Road junction | Routes meet and passing trade concentrates | Nucleated |
| Continuous coast road | Sites share access to a long edge and route | Linear |
The wording “may encourage” matters. The same physical setting can support different patterns under different technologies or institutions. A river once used for transport can lose that role after a motorway opens. A dry area with piped water can support settlement farther from springs. The guide to how rural and urban development changes land use examines these choices at a broader scale.
How settlement patterns change over time
Settlement patterns change when routes, livelihoods, hazards, technology, policy, or population movement alter the value of locations. New growth may extend an old form, replace it, or add a second pattern around the original settlement.
A bypass can draw shops and warehouses away from an old main street. Mechanised farming can reduce the number of workers living near fields. A new station can create a compact centre at the edge of a dispersed area. Flood damage can lead authorities to prohibit rebuilding in exposed sites. Suburban streets can surround a formerly separate village.
Change is often layered rather than complete. Street names, property lines, old paths, and the positions of religious or civic buildings can preserve an earlier form. A present day aerial image might show a dense modern suburb wrapped around a linear village street. Historical maps help separate the stages.
Movement matters at both ends. People leaving can create abandoned or seasonal buildings, while arrivals can produce new housing near work or transport. The relationship between relocation and place is covered in how migration reshapes communities.
Can one settlement have more than one pattern?
One settlement can contain several patterns because it grows in stages and responds to different features in different districts. A nucleated old centre, linear roadside extension, planned grid, and dispersed outer fringe may all belong to the same named place.
Classification depends on the boundary and question. If a map covers only the original village, “nucleated” may be accurate. If it includes later building along a highway, “nucleated with linear extension” is better. At regional scale, the entire place may appear as one compact dot.
A town has a church, market, and tightly packed houses at its centre. Shops and newer homes follow the main road east. Large detached homes occupy separate plots beyond the piped water network. The evidence supports three connected descriptions: a nucleated core, a linear extension, and a dispersed fringe.
A good answer states the dominant pattern, identifies any secondary pattern, and names the mapped evidence. It does not force every building into one category.
How settlement patterns show up in planning and public services
Settlement patterns shape the routes, costs, and response times of public services. Planners use building locations and expected growth to place roads, schools, clinics, pipes, power lines, waste collection, and emergency facilities where they can reach people effectively.
Consider a hypothetical district with 100 homes. Seventy stand in a compact village, 20 follow a road, and 10 are scattered on farms. These are invented values for a transparent planning exercise, not statistics about a real place.
A bus route could serve the village with a few closely spaced stops, continue along the road to reach the ribbon, and still fail to pass near the scattered farms. A central water system may be economical for the cluster but expensive for the final ten homes. The map therefore guides a mixed service design.
Emergency planning uses the same spatial logic. A compact area can place many people near one station, yet blocked streets can slow access. A dispersed area has less local congestion but longer response trips. Flood and wildfire plans must combine settlement pattern with hazard direction, road capacity, and possible escape routes.
How settlement patterns show up in everyday decisions
Settlement patterns affect everyday choices about travel, housing, shopping, schooling, utilities, and risk. A person meets the concept while checking a commute, choosing a property, planning deliveries, reading a news map, or deciding where a business can reach customers.
A home advertised as rural may be part of a linear ribbon with heavy through traffic. A short straight line distance to a school may hide a river crossing several kilometres away. A compact town may support walking to several services, while a dispersed area may provide space but require a vehicle for most trips.
Before choosing a site, compare layers. Plot the building, road access, contours, flood exposure, services, and nearby work. The settlement pattern becomes useful when it changes a decision.
Businesses perform a similar reading. A grocery shop needs enough customers within a practical travel area. A delivery firm cares about route length between addresses. A broadband provider compares the number of connections with the cable or wireless equipment required. An insurer may consider how quickly fire services can reach a site and whether nearby buildings can spread fire.
News reports also use settlement patterns, sometimes without naming them. A report about homes expanding along a highway concerns linear growth. A dispute over a development boundary concerns concentration and outward spread. A story about school closures in a farming district involves the service consequences of dispersed population.
Four mistakes people make with settlement patterns
Most errors come from treating a visual category as a complete explanation. Accurate analysis separates pattern from cause, states the scale, tests more than one factor, and allows mixed or changing forms when the mapped evidence supports them.
1. Naming a pattern without citing mapped evidence
A label needs an observable basis. “Linear” should be supported by buildings aligned along a road, river, coast, or narrow landform. “Nucleated” should be supported by close spacing around a centre. The evidence comes before the causal story.
2. Assuming that one feature caused the whole pattern
A road beside a row of houses is relevant, but it may not be the original cause. The houses could follow an older field boundary, river terrace, or path. Compare map dates, building orientation, land parcels, and local records before deciding.
3. Ignoring scale and boundaries
A compact village can form part of a dispersed regional pattern. Cutting a map boundary through the middle of a cluster can also make the points look less concentrated. State the study area and the unit represented by each point.
4. Treating categories as fixed boxes
Real settlements can be partly clustered and partly linear, or can change form over time. Categories are tools for describing dominant spatial relationships. They are not rules that every building must obey.
“The village is linear because there is a road.”
“Most buildings face the main road and occupy a narrow strip between the road and steep slopes. The alignment suggests that route access and limited flat land both influenced the linear form.”
The stronger version identifies the pattern, points to visible evidence, and proposes a mechanism that could be checked against contours, historical maps, or field observations.
Settlement patterns turn maps into explanations of human geography
Settlement patterns connect physical land, human choices, and spatial consequences. Once a pattern is described carefully, it can help explain access, inequality, land use, movement, public cost, hazard exposure, and the continuing effect of past decisions.
The next time you see an aerial image or travel through a town, identify the dominant arrangement. Find its centre or axis. Notice gaps, slopes, water, property edges, older buildings, and newer roads. Then ask which conditions made some sites more useful, affordable, or safe than others.
The takeaway: Describe the spacing first, test the mechanism second, and trace the consequences third. That sequence turns a pattern on a map into a geographical explanation.
This way of reading place also connects settlement to transport, population, culture, hazards, and development. Those wider relationships are part of the broader set of geography explanations, where location becomes evidence for how people and environments affect each other.