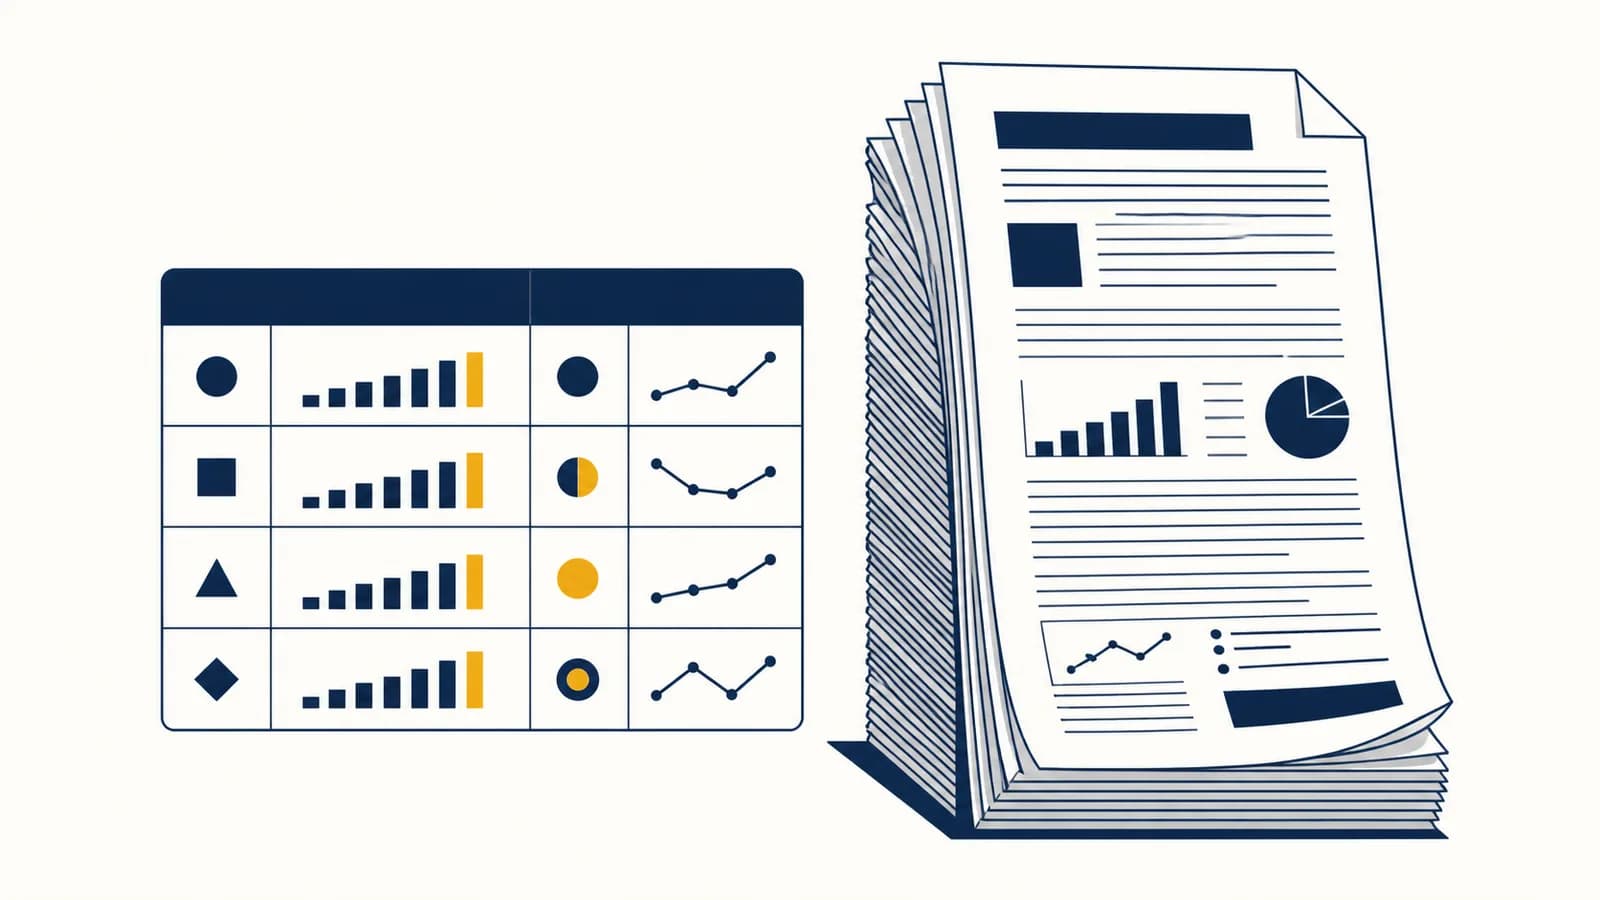
A small spreadsheet tests the business before prose does
A 10-minute business spreadsheet can beat a 10-page business plan because it exposes the numbers that decide whether an idea can survive. By the end, you can build a simple revenue, cost, and cash model, test its assumptions, and spot the question that deserves your next hour.
A written plan can describe customers, competition, marketing, and operations. Those subjects matter, but polished sentences can hide a weak calculation. A spreadsheet forces each important belief into a cell. How many buyers will there be? What will each buyer pay? What does one sale cost to fulfil? How much cash must leave before any cash arrives?
“We will attract local students with affordable tutoring and grow through recommendations.” The words sound reasonable, but they do not define affordable, local, or enough students.
Eight sessions a week at £18 each produce £144 of weekly revenue. Subtract room hire, travel, materials, and payment fees. The remaining amount can be compared with the hours worked.
The spreadsheet does not prove that eight sessions will sell. It makes the assumption visible. That is useful because visible assumptions can be checked. You can ask potential customers, run one trial session, or compare nearby offers. A paragraph often bundles several guesses together. A cell gives each guess an address.
What must the first sheet contain?
The first sheet needs only five working parts: units sold, price per unit, variable cost per unit, fixed costs, and the period being measured. Those inputs produce revenue, total cost, profit, and cash need without pretending that the future is already known.
A unit is the smallest thing that earns revenue. It might be one tutoring session, one repaired bicycle, one monthly subscription, or one tray of cakes. Pick a period that matches the business rhythm. A week may suit a market stall. A month may suit a subscription. Use one period throughout the model so that weekly sales are not accidentally compared with monthly rent.
These are invented inputs for a worked example, not claims about a real firm. Their value comes from the visible arithmetic. Twelve orders at £15 give £180 of revenue. Ingredients, packaging, or other per-order costs total £72. After £70 of fixed costs, the model leaves £38.
Worked example: .
The symbols are ordinary arithmetic used to test a business idea. Multiplication connects the amount sold to the value or cost of each sale. Subtraction shows what remains. If the answer is disappointing, the sheet has done useful work before money was committed.
How do you build the model in 10 minutes?
Build it by separating inputs from calculations, entering one assumption per row, and using formulas rather than typed totals. The aim is a model you can change safely, not a decorative forecast filled with colours, merged cells, and unexplained numbers.
Write “order” and “week,” for example. Put both near the top so every number has a clear meaning.
Add units sold, price per unit, variable cost per unit, and fixed costs. Mark these input cells with one consistent fill colour.
Use cell references to calculate revenue, variable costs, total costs, and profit. Do not type an answer that a formula can produce.
Try a lower sales figure or a higher cost. Watch which outputs move and by how much.
Keep evidence beside each input. A price might come from an actual quote. A packaging cost might come from a supplier listing divided by the number of packages in a box. Expected sales might come from paid test orders, not likes on a post. A spreadsheet is more trustworthy when each input has a short note stating its source.
This chain matters. The formula may be flawless while the input is nonsense. If expected orders are based only on hope, the calculated profit is hope with decimal places. Store the source, date, and meaning of important inputs as carefully as records in a well designed database. Structure makes later checking much easier.
Which number tells you if each sale helps?
Contribution per unit tells you how much one additional sale provides toward fixed costs and then profit. It equals the selling price minus the variable cost of that sale. A positive contribution helps, but it does not guarantee that the whole business makes money.
In the worked example, each £15 order carries £6 of variable cost. The contribution is therefore £9. The first orders of the week cover the £70 of fixed costs. Only after those costs have been covered does further contribution become operating profit.
Worked example: contributed by each order.
Contribution also reveals bad growth. Suppose a seller charges £15, but materials, delivery, payment processing, and piece-rate labour total £17 for every order. Each extra sale loses £2 before fixed costs are considered. More orders make the total loss larger. Revenue is rising, yet the business is moving in the wrong direction.
Do not treat your own time as free. If the work takes 45 minutes per order, include a target payment for that time or show it separately. Otherwise the sheet may call unpaid labour “profit.”
Some costs do not fit perfectly into one box. Electricity may have a standing charge plus usage. Labour may be fixed for a scheduled shift but variable over a longer period. Choose the classification that matches the decision you are testing, and write down the choice. The model should be simple, not careless.
How many sales cover the fixed costs?
The break-even quantity is the number of units whose contribution covers fixed costs. Divide fixed costs by contribution per unit, then round up when only whole units can be sold. It marks a threshold, not a promise that customers will appear.
Worked example: , so at least 8 complete orders are needed.
At seven orders, contribution is £63, which is £7 short of the fixed costs. At eight orders, contribution is £72, leaving £2. The rounding step changes the practical answer. A sheet that reports 7.78 cakes, haircuts, or repair jobs has calculated a mathematical threshold, but the operating target must use whole units.
A student plans a Saturday bicycle cleaning service. Supplies cost £3 per bicycle, the price is £12, and a market pitch costs £45 for the day. Contribution is £9 per bicycle, so five bicycles cover the pitch fee. The next question is concrete: can five paying customers be booked before Saturday?
The scenario shows how finance sends you back into the world. If five bookings seem realistic, take deposits or schedule appointments. If they do not, test a cheaper location, a higher price, or a service with lower material cost. Break-even analysis turns “Is this a good idea?” into a question that evidence can answer.
Why can profit still leave you short of cash?
Profit measures revenue minus costs assigned to a period, while cash flow tracks when money actually enters and leaves. A business can show a profit yet run out of cash because suppliers are paid before customers pay, or equipment is bought upfront.
Imagine a school event orders 40 printed shirts at £12 each. The shirts cost £7 each to produce, so the order appears to create £200 before fixed costs. But the printer requires the £280 production payment now, while the school pays the £480 invoice next month. The seller needs £280 of cash to bridge the timing gap.
| Moment | Cash in | Cash out | Running cash change |
|---|---|---|---|
| Order placed | £0 | £280 | −£280 |
| Invoice paid | £480 | £0 | £200 |
The negative sign is not an invented statistic. It follows directly from the example. The table shows a funding need that a profit total hides. A deposit could reduce the gap. Supplier credit could shift the payment date. A smaller first order could reduce exposure. Each response changes timing, so add dated cash rows to the sheet.
Cash timing also explains why growth can create strain. More orders may require more stock before earlier customer invoices have been paid. The sheet should therefore include opening cash, dated receipts, dated payments, and a running balance. If that balance falls below zero, the plan needs different terms, more starting cash, or a slower pace.
How do you test an assumption without pretending to predict?
Test an assumption by creating a small set of plausible cases and changing one or two inputs at a time. This is sensitivity analysis. It shows which beliefs control the result, while keeping uncertainty visible instead of burying it in one confident forecast.
Return to the order example with a £15 price, £6 variable cost, and £70 fixed costs. At eight orders, profit is £2. At twelve, it is £38. At sixteen, it is £74. Each four-order increase adds £36 because each additional order contributes £9.
The bar lengths compare the three calculated profits, with £74 shown as the full reference width. They are not probabilities. That distinction matters. A scenario says, “If 12 orders arrive, this result follows.” A forecast adds a claim about how likely 12 orders are. The second claim needs evidence.
Use three cases if they help you think: a low case based on weak demand or higher costs, a central case supported by current evidence, and a high case that still has a believable mechanism. Do not call the central case “realistic” merely because it sits in the middle. Label every input with the observation or test behind it.
The most sensitive assumption deserves the next experiment. If a small change in sales destroys the result, test demand. If a small increase in material cost destroys it, get firm supplier quotes. This resembles careful context design for an AI system: the output depends on the quality, structure, and limits of what goes in.
The spreadsheet earns the right to a longer plan
A short model should come before a long plan because it identifies the few facts that deserve research. Once demand, contribution, break-even volume, and cash timing look workable, prose can explain operations, customer acquisition, risks, legal duties, and the evidence behind the numbers.
The spreadsheet cannot decide everything. It cannot tell you why customers trust one seller, how a product should feel, which laws apply, or what harm a project could cause. It also cannot convert a guess into a fact. Those questions need interviews, observation, subject knowledge, and sometimes professional advice.
Use prose to explain evidence and action. Use cells to expose quantities and consequences. If a paragraph contains a number that changes the decision, connect it to the model rather than leaving it buried in a sentence.
A fuller plan becomes valuable when other people must coordinate. A lender may need formal forecasts and evidence. A partner needs clear responsibilities. A regulated activity needs documented compliance. Research may also reach beyond business subjects. A food producer may need biology, while a farming project may depend on climate, soil, and the wider study of people, resources, and places.
Before expanding the document, ask the sheet four tests. Does every important input have a source? Does each formula use the intended period and unit? Does the lowest cash balance stay above zero? Which assumption changes the decision fastest? If an answer is missing, the next task is measurement, not more pages.
The takeaway: Build one small sheet with visible inputs, formulas, and cash dates. Use it to find the fragile assumption, test that assumption cheaply, and write a longer business plan only when the evidence has something useful to say.
Ten minutes is not enough to understand an entire business. It is enough to reveal a price that cannot cover costs, a break-even target that demand cannot support, or a cash gap that arrives before payment. Finding any one of those early can save far more than ten pages of confident prose.