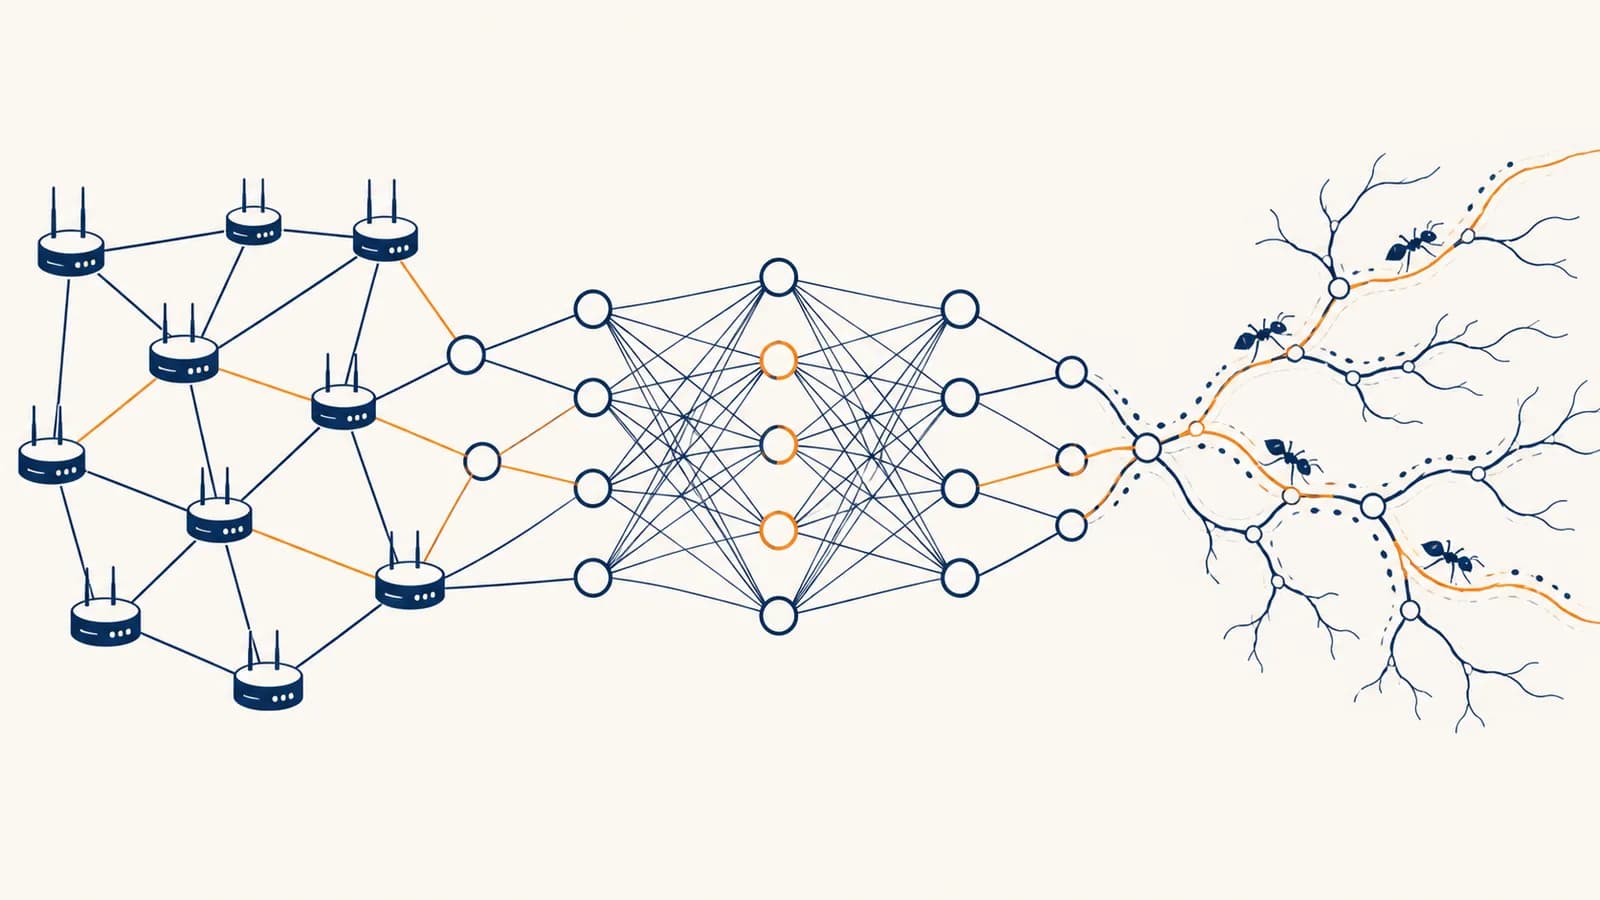
Networks are physical systems made of nodes and connections
A network is a set of parts linked so that matter, energy, or information can move between them. The physics of networks explains why the internet, the brain, and ant colonies can show similar patterns even though their parts and signals are different. By identifying nodes, links, paths, and feedback, you can predict where a network will move quickly, where it will jam, and how it may fail.
The first move is to ignore some detail without ignoring the mechanism. A map of the internet can treat routers as nodes and data links as edges. A brain map can treat neurons as nodes and synapses as directed, weighted edges. A colony study might use ants as nodes and recent contacts as temporary edges, or junctions as nodes and trail segments as edges. The useful representation depends on the question.
The same network pattern does not mean the same physical system. An optical pulse, an electrical change across a neuron membrane, and an ant following pheromone obey different local physics. Network science compares the structure through which their effects spread.
Once the representation is chosen, graph theory supplies a compact language. A node's degree is its number of links. A path is a sequence of links connecting two nodes. Path length counts links, while a weighted path can count time, distance, energy, or another cost. These ideas sit within Mathematics, especially graph theory, probability, and dynamical systems.
Edges may be directed or undirected. A web link points one way, while a cable usually carries signals both ways. Edges may also carry weights. A strong synapse has more effect on its target neuron than a weak one. A fast fiber connection and a congested wireless connection should not be assigned the same cost.
What can one graph say about the internet, a brain, and ants?
One graph can reveal shared constraints: every signal needs a route, busy nodes have finite capacity, and alternative paths affect resilience. It cannot erase the physical differences, but it can expose which outcomes come from connection patterns rather than the material of the system.
Nodes, edges, degree, path length, clustering, capacity, and feedback can describe all three systems.
Routers follow protocols, neurons change voltage and release neurotransmitters, and ants sense chemicals and make movements.
Consider what travels. Internet routers forward packets containing bits. Neurons pass changes in electrical potential along axons and communicate across most synapses chemically. Ant colonies move workers and food through space while chemical traces carry information about recently used routes. In each case, the state of one part can change the future behavior of connected parts.
A graph also forces precise questions. Is the network connected, meaning every node can reach every other node by some path? Which node lies on many shortest paths? How many independent routes join two regions? Which links have low capacity? Such questions turn a complicated picture into quantities that can be measured or calculated.
Why does ten edges produce an average degree of 2.5 rather than 1.25? Every undirected edge touches two nodes, so it contributes two to the sum of all degrees. This is the handshake rule: the degree total is twice the number of edges.
With 10 edges and 8 nodes, the average degree is .
This average is useful but incomplete. A ring in which every node has degree two and a hub network with a few highly connected nodes can share the same average degree. Their traffic, failure patterns, and response to an attack can be very different.
Why do short paths appear inside huge networks?
Short paths appear when a mostly local network contains a smaller number of long connections. Local links make clusters, while long links act as shortcuts between clusters. Together they can keep typical route lengths low without requiring every node to connect directly to every other node.
Imagine twenty classrooms arranged along a corridor. If messages pass only between neighboring rooms, reaching the far end requires many handoffs. Add a few links between distant rooms and the route can shrink sharply. The extra links do not need to form a complete web. Their position matters more than their number.
This pattern is called a small-world structure when high local clustering appears alongside short typical paths. It is a mathematical property, not a claim that every network has exactly the same path length. The internet contains local provider networks joined through wider connections. Brain networks include dense local circuitry and longer projections. Ant trail systems can connect nearby activity through junctions that lead to distant food sources.
Short in link count does not always mean fast. A route with three congested links can take longer than a route with five clear ones. Network models therefore assign each edge a cost and ask for the path with the lowest total cost.
If three links take 8 ms, 12 ms, and 5 ms, the path cost is .
That distinction is practical. A phone can render an interface instantly but still feel slow because a request crosses a high-latency route or waits at a loaded server. Building responsive systems in Mobile App Development: iOS, Android, and Cross-Platform therefore involves network delay, caching, and graceful behavior when a connection disappears.
Why are hubs both efficient and dangerous?
A hub connects to many nodes or carries many routes. It can shorten paths and reduce the need for duplicate infrastructure, but it also concentrates load and damage. Losing one ordinary node may be minor; losing a central hub can separate whole regions.
Degree identifies one kind of hub. Betweenness identifies another by counting how often a node lies on shortest paths. A node can have modest degree yet bridge two dense communities, giving it high betweenness. A router joining two networks, a neural tract linking brain regions, or a trail junction joining nest and foraging branches can play this bridging role.
A school network has two computer rooms, each with many internal connections, but one switch joins the rooms. That switch has fewer direct links than some devices inside the rooms, yet every cross-room packet depends on it. Its position makes it a bottleneck and a single point of failure.
Traffic also changes the network it uses. As a link fills, queues grow and delay rises. Delayed packets may trigger retries, adding more traffic. Ants crowding a narrow trail can reduce movement speed. Groups of active neurons draw on local metabolic support and may be limited by inhibition. Capacity is therefore part of the model, not a decorative label on an edge.
Networks with broad degree distributions often respond differently to random failure and targeted removal. Randomly choosing a node is likely to hit one of the more numerous low-degree nodes. Deliberately removing a major hub can do more structural damage. This is a tendency, not a universal law. Redundant links, spare capacity, direction, and recovery procedures can reverse a simple prediction based only on degree.
The engineering response to hub risk is selective redundancy. A backup route helps only if it does not share the same likely failure. Two cables laid through the same duct look like two edges in a logical diagram, but one cut can break both. Physical location must sometimes be included in the network model.
How do local rules produce collective behavior?
Collective behavior appears when each node responds to nearby signals and those responses alter later signals. Repeated across a network, local feedback can amplify a path, suppress activity, spread a state, or settle the system into a pattern that no node planned globally.
Ant trail selection gives a clear example. A forager that finds food can deposit pheromone while returning. Other ants are more likely to follow stronger chemical traces, and successful travelers add more pheromone. If one route is shorter under comparable conditions, ants can complete it more often in a given time, reinforcing it faster. Evaporation weakens routes that stop being used.
The feedback is positive because use encourages more use. Evaporation provides a counteracting process, allowing an abandoned route to fade. Without exploration, a colony could remain stuck on the first adequate path it found. Random variation in movement helps test alternatives, while reinforcement retains routes that keep succeeding.
Neural networks also combine local input, thresholds, and feedback, but the details differ. A biological neuron receives signals through many synapses, integrates their effects over space and time, and may generate an action potential. Inhibitory connections reduce the chance of firing. Changes in synaptic strength let past activity affect future transmission. The system's behavior comes from both wiring and changing node states.
Activity makes further activity more likely. It can strengthen a trail, accelerate adoption, or synchronize connected units.
Activity produces an opposing effect. It can limit firing, reduce congestion, or weaken an unused route through decay.
Human networks add memory, beliefs, and strategic choice. A person's decision may depend on what friends chose, but also on price, trust, or identity. Models from Behavioral Economics help explain why the same contact pattern can produce different choices when incentives and biases change.
What does physics add beyond drawing a graph?
Physics adds laws for how states change, how flows consume capacity, and how many local interactions create large-scale patterns. A static graph says who can affect whom. A dynamical model says what happens next and under which conditions the behavior changes sharply.
One basic process is diffusion. Heat flows between places with different temperatures. On a network, an analogous quantity moves between connected nodes according to their difference. The quantity could represent temperature in a material network or a simplified concentration in a transport system. The graph determines which exchanges are allowed.
Here when nodes and are linked, and controls how much moves in one step.
The same equation should not be pasted onto every system. Internet packets are discrete and routed, action potentials do not simply diffuse across an entire neural graph, and ants make decisions while moving through continuous space. The equation is useful when its assumptions match the process being studied.
Statistical physics studies how system-wide order can emerge from many interacting parts. A network may change gradually as links are added, then cross a threshold where a large connected component appears. This is related to percolation. The exact threshold depends on the network model, so there is no single percentage that applies to the internet, brains, and colonies.
Conservation and accounting matter too. Packets cannot leave a router faster than its outgoing capacity for long without a queue growing or packets being dropped. Ants entering a narrow passage must also leave, wait, or turn back. A model that creates flow without a source, or removes it without a sink, hides the mechanism it is meant to explain.
How do networks fail, adapt, and recover?
Networks fail when nodes or links lose function, when demand exceeds capacity, or when local responses amplify stress. They recover by rerouting flow, reducing demand, repairing components, or changing connections. Resilience depends on both structure and response rules.
Failure can cascade. Suppose one route closes and its traffic moves to a second route. If the second route was already near capacity, the added load can close it too. More traffic is then displaced. A small initial event has become a system-wide problem through redistribution, not because every component failed independently.
A cable breaks, a neural pathway is impaired, or a trail becomes blocked.
Flow shifts onto the remaining paths according to protocol, behavior, or physical constraints.
A backup path succeeds if it can carry the load. If it overloads, another failure may follow.
Connectivity alone is not enough. Delay, throughput, accuracy, and energy use may have changed.
This procedure separates structural resilience from functional resilience. A graph can remain connected while service becomes unusably slow. A brain can reroute some function without recreating the original circuit. Ants can discover a detour that reaches food but costs more time and energy.
Network effects can also cross ownership boundaries. One user's traffic, infection risk, pollution, or security choice can change costs for connected people. Economists describe many such spillovers as Externalities. The network shows the transmission paths; economics asks how incentives and institutions handle costs that private decisions do not fully include.
Resilience testing therefore needs more than a random deletion experiment. Test high-load edges, bridge nodes, shared physical locations, and failures that occur together. Then allow the system to respond. A frozen graph can identify lost paths, but it cannot represent rerouting, learning, repair, or the extra load placed on survivors.
Connectivity is not performance. Two nodes may still have a path between them after damage, yet the remaining path may be too slow, crowded, noisy, or energy-intensive to perform the required job.
Recovery can change future risk. Adding a new route may relieve congestion, but users may shift toward it until demand rises again. Strengthening a hub may improve normal performance while increasing dependence on that hub. Each intervention changes the network on which the next event will unfold.
Network thinking turns structure into testable predictions
The useful shared rule is simple: connections constrain motion, local responses reshape flow, and feedback changes later choices. Those ingredients let one mathematical language describe parts of the internet, the brain, and ant colonies without pretending that packets, neurons, and insects are interchangeable.
To analyze a new case, begin by stating what the nodes and edges represent. Name what travels, identify the cost and capacity of each link, and choose the time scale. Then ask which paths are short, which nodes bridge communities, and which feedback loops amplify or limit activity. Finally, compare the prediction with observation.
Draw the routes between rooms in a building. Use junctions as nodes and corridors as edges. Assign each corridor a walking time, then close one corridor and calculate the new shortest routes. Observe the actual crowding during a class change. Any mismatch tells you which missing feature, such as capacity or route preference, belongs in the next model.
A strong network model states its boundary. Leaving out a router, brain region, rival food source, or outside contact can change the result. It also states whether edges were observed directly or inferred from behavior. A neat diagram is not evidence that the chosen nodes and links capture the process.
Similarity across networks is most useful when it produces a checkable forecast: a bridge will carry disproportionate traffic, a shortcut will reduce route cost, reinforcement will stabilize a used path, or overload will move after a failure. If the forecast fails, the model needs another mechanism or a different graph.
The takeaway: Network physics connects structure to behavior. Map the right nodes and links, add the physical rules for flow and feedback, and the diagram becomes a model that can explain speed, coordination, congestion, and failure.
The deepest commonality is not a particular shape. It is the discipline of connecting local causes to system-wide effects. Once each edge has a meaning and each update rule has a mechanism, a network stops being a metaphor and becomes something that can be calculated, measured, challenged, and improved.