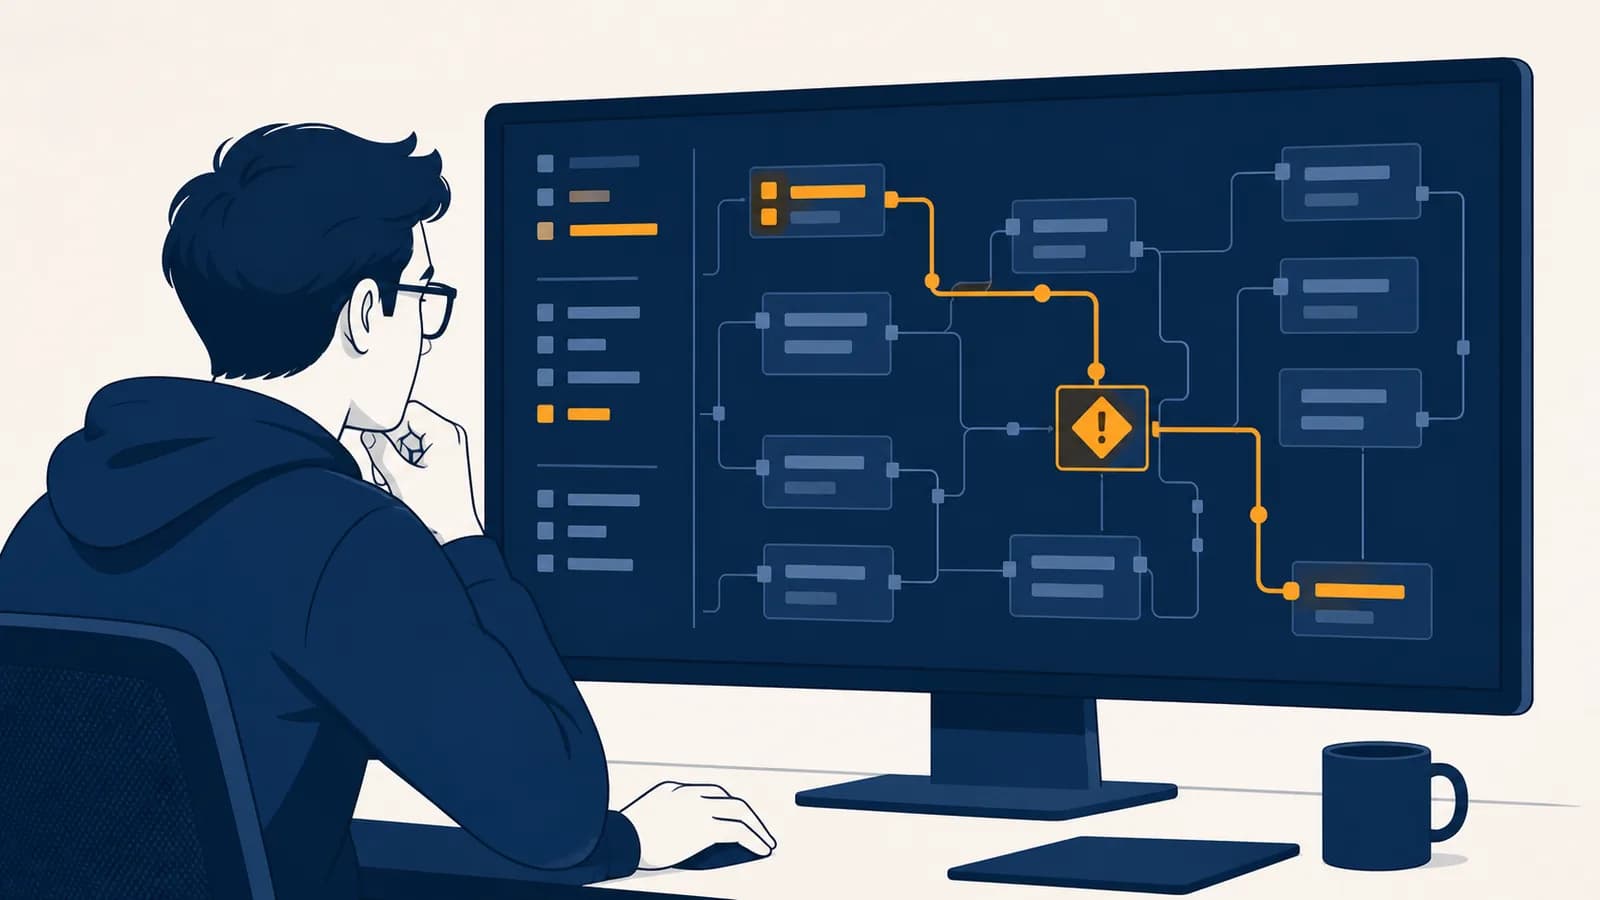
Debugging is a problem-solving process that finds, explains, and fixes defects, in the context of computer programs and software systems. A bug is any difference between what a program should do and what it actually does. To debug code, a programmer reproduces the failure, gathers evidence, narrows the possible causes, tests a hypothesis, and checks the repair. Debugging exists because code can be valid enough to run while still producing the wrong result, failing only for certain inputs, or interacting badly with another system. Good debugging replaces guessing with controlled experiments.
What debugging actually is
Debugging is the disciplined search for the cause of an observed software failure. It connects a visible symptom, such as a wrong total or a frozen screen, to the exact condition, instruction, or interaction that produced it, then verifies a correction.
The word bug covers more than misspelled code. A program can contain a syntax error that prevents it from starting, a logic error that calculates the wrong answer, a data error caused by an unexpected input, or a timing error that appears only when events occur in a certain order. Debugging is the work of separating those possibilities with evidence.
Consider a shop program that applies a 20 percent discount:
final_price = price - 20 / 100
The line is legal in many languages, so the program runs. For a price of 50, however, it returns 49.8 instead of 40. The program subtracts 0.2 currency units rather than 20 percent of the price. The symptom is a wrong total. The cause is a faulty expression. The corrected relationship is:
For a price of 50 and a rate of 0.20: .
A fix is not established merely because the edited line looks better. The programmer reruns the failing example, checks ordinary examples, and checks boundary cases such as a zero price or a zero discount. The repair must change the bad behavior without damaging behavior that was already correct.
A symptom identifies where the program’s behavior became visible; evidence identifies what caused that behavior.
That distinction explains why debugging is different from random editing. Changing several lines at once may make the symptom disappear, but it hides which change mattered. A controlled change produces knowledge that can be used on the next failure.
How a bug becomes visible
A bug becomes visible when a program’s actual state or output conflicts with an expected result. The conflict may appear as an error message, incorrect data, slow behavior, or silence where an action should occur, but every useful investigation begins with that observable gap.
Programs transform inputs through a sequence of states. A user enters text. The interface sends a request. A server checks the request. A database stores or retrieves a value. The server returns a response, and the interface renders it. A defect at any stage can surface somewhere else.
Suppose a sign-up form displays “Email already used” for a new address. The message appears in the browser, but the browser may not be the source. The server might remove dots from addresses incorrectly. The database query might search the wrong column. A test account might already exist in a hidden environment. The location of the symptom is only the first clue.
A useful bug report turns a vague complaint into a reproducible observation. “Sign-up is broken” gives little to test. “On the test site, entering [email protected] and selecting Create account returns status 409, although no matching user appears in the users table” identifies the environment, action, input, observed response, and expected state.
Expected versus actual is the first comparison. If the expected result is unclear, the investigation may be arguing with a design decision rather than finding a defect.
Expectations can come from a written requirement, an automated test, a standard, or an agreed example. They can also be wrong. A calendar that rejects February 29 in 2025 is behaving correctly because 2025 is not a leap year. Before searching code, confirm that the claimed failure really conflicts with the intended rule.
How debugging works
Debugging works as a cycle of reproduction, observation, hypothesis, experiment, repair, and verification. Each pass should reduce uncertainty. The process ends only when the cause is understood, the original failure no longer occurs, and checks show that the change did not create another defect.
Write down the smallest dependable sequence that triggers the problem, including input, environment, and expected result.
Read the error, logs, request details, variable values, and call stack before editing code.
Remove unrelated inputs or components until the failure still occurs in a smaller example.
Name a cause that predicts the evidence, such as “the loop skips the final item because its stopping condition is too early.”
Choose an observation that would differ if the hypothesis were false. Inspect the last loop index, for example, instead of adding unrelated print statements.
Make the smallest clear correction, rerun the original case, then run nearby cases and the broader test suite.
Imagine a function meant to total the numbers in a list, but it ignores the last number. The list [4, 7, 9] returns 11. A useful hypothesis is that the loop stops one position early. Printing every index would show 0 and 1, but not 2. Changing the loop bound fixes the original input, and tests with an empty list, a one-item list, and a longer list establish how the function behaves around the boundary.
This cycle is scientific in a practical sense. A hypothesis must make a prediction. “Something is wrong with the loop” is too broad. “The condition i < length - 1 excludes the final valid index” predicts exactly which index will be missing. The program can answer that claim through a trace or debugger.
Small examples are especially valuable while learning how variables, loops, and machine-like execution fit together. A five-item list can reveal the same faulty condition as a file containing thousands of records, while making each state easy to inspect.
A minimal example is not always tiny, especially when timing or network behavior matters. Its purpose is to remove irrelevant variables, not to meet a line count. A good example can be run repeatedly and produces an observation another person can compare with yours.
Syntax errors versus logic errors
Syntax errors violate the language’s grammar and usually stop code from being parsed, while logic errors use valid instructions that produce an unintended result. The first kind often points to a location immediately; the second requires comparing the program’s behavior with the intended rule.
if score > 50 print("pass") may be missing punctuation required by the language. The parser reports that it cannot form a valid instruction.
if score > 50 excludes a score of exactly 50 if the rule says 50 counts as a pass. The instruction is valid, but the boundary is wrong.
Runtime errors form another category. The program starts, then reaches an operation it cannot complete. It may divide by zero, access a missing file, or call a method on a null value. An exception often provides a message and a stack trace, which lists the active function calls at the point of failure.
Failures can also be classified by where their causes live:
| Failure type | Typical symptom | Useful first evidence |
|---|---|---|
| Syntax | Program will not parse or start | Parser message and marked line |
| Runtime | Program stops during execution | Exception message and call stack |
| Logic | Program finishes with a wrong result | Expected output and intermediate values |
| Performance | Program responds too slowly or uses too much memory | Profiler measurements and input size |
| Integration | Components work alone but fail together | Request, response, configuration, and version details |
The categories guide the first tool, not the final conclusion. A network request may time out because a loop is too slow. A displayed blank value may begin with a database query that returned no row. Useful debuggers follow the chain of cause and effect across category boundaries.
How evidence narrows the search
Evidence narrows a debugging search by ruling out possible causes and locating the first state that differs from a correct run. Logs, breakpoints, tests, traces, and controlled input changes are useful only when each observation separates competing explanations rather than producing more noise.
Suppose a function fails somewhere in 64 ordered processing stages. If you inspect each stage from the beginning, the search may require many checks. If you can test the midpoint and determine which half contains the first wrong state, you can repeatedly halve the candidate region:
Checking a midpoint can reduce 64 candidates to 32, then 16, 8, 4, 2, and 1.
This is the idea behind binary search debugging. It works when you can place meaningful checks along an ordered path, such as commits in history, stages in a pipeline, or lines in a deterministic calculation. It does not work cleanly if the failure changes randomly between runs.
A log records what happened
A log is a time-stamped record emitted by a running system. Useful entries identify the event, relevant context, and outcome without exposing passwords or private data. “Payment failed” is weak. “Payment request rejected, order 812, validation reason: missing postal code” gives a searchable event and a testable cause.
Logs are strongest when they cross component boundaries. A request identifier carried through the browser, server, and worker lets a programmer connect events belonging to the same operation. Without that link, messages from many users can look like one confused sequence.
A breakpoint pauses a live execution
A breakpoint tells a debugger to pause before or after a chosen instruction. While paused, a programmer can inspect variables, evaluate expressions, view the call stack, and move through the program one statement at a time. A conditional breakpoint pauses only when a rule is true, such as item.id == 812.
Stepping clarifies control flow. Step over executes a called function without entering it. Step into enters the function. Step out runs until the current function returns. These actions answer different questions about which instruction ran and which caller supplied a value.
An automated test preserves the discovery
A regression test is an automated example that fails before a repair and passes after it. It converts a discovered bug into a permanent check. If the discount function mishandles 20 percent, a test can assert that a price of 50 and a rate of 0.20 produce 40.
The test should fail for the expected reason before the code is repaired. A test that already passes does not prove it captures the bug. Afterward, it guards against a later edit reintroducing the same behavior.
How debugging shows up in real settings
Debugging appears anywhere software controls a result, including websites, laboratory instruments, financial records, public services, and personal devices. In each setting, the same method applies, but the evidence and consequences change because systems have different users, data, timing, and safety constraints.
Web applications split one symptom across several machines
A button that does nothing might be disabled by interface code, blocked by a browser error, rejected by a server, or delayed by a database. Browser developer tools reveal the document, JavaScript console, network requests, storage, and timing. Server logs reveal what arrived and how the server responded.
A weather page shows yesterday’s forecast. The browser received a successful response, but the response includes an old timestamp. That evidence moves the search away from page rendering and toward server caching, data collection, or an upstream service.
Applications often rely on rules for requests and responses. Learning how software interfaces exchange structured messages helps a debugger distinguish a malformed request, an authorization failure, a server defect, and a valid response that the interface misread.
Data and money bugs require reconciliation
In a payroll or inventory system, a plausible total can still be wrong. Debuggers reconcile the final number with its source records and transformations. If 12 items entered a pipeline but only 11 reached the result, counts at each stage can locate where one record was filtered out.
Money calculations also expose representation errors. Many programming languages store ordinary decimal-looking numbers as binary floating-point approximations. Adding 0.1 and 0.2 may not produce an internal value exactly equal to 0.3. Financial software commonly uses integer minor units or a decimal type so equality and rounding follow the required rules.
Physical systems demand safe reproduction
Software in a robot, vehicle, medical device, or laboratory instrument affects physical equipment. Reproducing a bug on the live machine may be unsafe or expensive. Teams use simulations, recorded sensor inputs, test hardware, and restricted operating modes to recreate conditions without exposing people or equipment to the original risk.
Timing matters in these systems. A sensor value may be correct but arrive too late. Two tasks may update shared state in an unexpected order. A debugger therefore records event times, task states, and inputs rather than inspecting only the final value.
Collaboration adds another source of evidence. A history of small changes can show exactly when a failure appeared. The ideas behind tracking changes and restoring known states make it possible to compare a working revision with a failing one and test the revisions between them.
Five mistakes people make with debugging
Most unproductive debugging comes from losing control of the experiment. Common mistakes include editing before observing, changing several variables together, trusting the visible symptom, ignoring environmental differences, and stopping after one successful run. Each mistake leaves the cause uncertain or the repair unverified.
1. Editing before reading the evidence
Immediate editing can destroy the original state and add new behavior. First capture the exact message, stack trace, input, version, and reproduction steps. A screenshot can preserve a visible message, but copyable text is better for searching and comparing.
2. Changing several things at once
If a programmer changes a condition, updates a library, and clears a cache before rerunning, a passing result does not reveal which action mattered. Change one independent factor when possible. If several changes are inseparable, record them as one experiment and test smaller combinations afterward.
Make broad edits, rerun, and keep whatever seems to work. The symptom may vanish, but the explanation stays weak.
Predict an observation, change one condition, and compare the result. The outcome supports or rejects a named cause.
Controlled changes can feel slower for the first few minutes. They usually save time because each run reduces uncertainty and leaves a record another person can follow.
3. Fixing the symptom instead of the cause
If a program crashes on a missing customer address, replacing the missing value with an empty string may hide the crash. It does not explain why a required address was absent. The real repair might belong in input validation, a data migration, or the rule that marked the address as required.
4. Assuming every machine is equivalent
Code can behave differently because of operating systems, processor designs, time zones, language versions, installed packages, permissions, feature settings, or data. “Works on my machine” is evidence that the environments differ. It is not evidence that the reported failure is imaginary.
Record the differences that can affect execution. A dependency lockfile, container definition, and documented configuration reduce accidental variation. Secrets should never be pasted into a bug report or log.
5. Stopping when the original example passes
A repair can overfit one case. Changing > to >= may fix a boundary, but the function still needs checks below, at, and above that boundary. Run nearby examples, regression tests, and tests for connected behavior. Then review the change for clarity.
A disappearing symptom is not proof of a repair. The failure may depend on timing, cached state, or data that changed between runs. Verification must control those conditions.
A good final note explains the cause, the change, and the evidence. “Fixed login” is hard to review. “Normalize email case before the uniqueness query; added a test for mixed-case duplicates” tells the next programmer what failed and why the change belongs there.
How do you debug code that fails only sometimes?
Intermittent failures are debugged by capturing the conditions that vary between runs, then making those conditions repeatable. Random seeds, event order, network timing, shared state, resource limits, and external data are common variables; detailed traces and repeated automated runs help expose their pattern.
First estimate what changes. If a generated test sometimes fails, record its random seed so the same sequence can be replayed. If two tasks race to update one value, log when each reads and writes. If a request fails only under load, record queue length, response time, and resource use around the event.
Do not “fix” an intermittent test by adding an arbitrary delay. A delay changes timing and can make the race less likely without removing it. Better synchronization makes the required order explicit, while a controlled scheduler or repeated stress test helps confirm the original ordering fault.
Two browser tests create users with the same fixed email. Each test passes alone, but parallel runs sometimes collide. Adding a unique test identifier removes shared data, while a regression test running both cases together verifies the diagnosis.
Intermittent does not mean uncaused. It means the cause includes a condition that has not yet been measured or controlled.
How do you debug code you did not write?
Code you did not write is debugged by treating behavior, tests, interfaces, and change history as evidence before trying to understand every line. Reproduce the failure at a boundary, trace only the path involved, and read outward from the smallest relevant function.
Start with the public behavior. What input crosses the boundary, what output returns, and what promise does the component make? Then find the call site and follow the failing path. Tests often provide shorter explanations of intended behavior than implementation files because each test names an example and expected result.
Use names and structure as a map, but verify them. A function named validateOrder may check only payment details. Comments may describe an older design. Running code, current tests, and current requirements carry stronger evidence than a plausible name.
History answers a different question: what changed? Comparing a known working revision with the first failing revision can shrink a large codebase to a few edits. Ask the original author when available, but bring a reproducible case and observations so the conversation starts with facts.
How do debugging tools change across languages?
Debugging tools differ in commands and presentation, but they expose the same basic facts: errors, values, control flow, calls, time, and resource use. The right tool depends on the execution environment and the question, not on a universal ranking of debuggers.
Compiled languages may report errors during compilation and provide native debuggers for machine-level execution. Interpreted languages often offer interactive consoles and stack traces immediately. Browser code adds developer tools for the document, styles, scripts, storage, and network traffic. Database systems provide query plans and transaction logs.
A beginner working with readable Python code and its interactive tools can still use the same reasoning later in Java, JavaScript, or C. Print statements, structured logging, breakpoints, profilers, and tests differ in detail, but each should answer a specific question.
Choose the least complicated tool that can distinguish the current hypotheses. A print statement may be enough to prove a loop bound is wrong. A breakpoint is better when several variables interact. A profiler is necessary when the problem is time or memory, because intuition about expensive code is often unreliable.
Tool skill matters, but question quality matters more. “Show me everything” creates noise. “Did this function receive a null customer, and which caller passed it?” selects a location, value, and call relationship that a debugger can reveal.
Debugging turns programming into testable reasoning
Debugging turns programming into testable reasoning because every repair connects a claim about cause to observable evidence. It strengthens knowledge of data, control flow, systems, and design, while showing that reliable software comes from explanations that survive repeated checks.
Writing code asks, “What instructions should produce this result?” Debugging asks the reverse: “Given this result, which executed instructions and states produced it?” Moving comfortably in both directions is a central programming skill. It reveals how source code becomes behavior across memory, files, networks, and people’s actions.
The wider set of computer science explanations grounded in real systems shows the same habit at different scales. Algorithms predict how work grows. Data structures predict how information is stored. Networks predict how messages move. Debugging checks those predictions against an actual machine.
The takeaway: On the next bug, write the expected result and actual result before touching the code. Reproduce the failure, collect one useful observation, state one cause that predicts it, and run the smallest test that could prove the cause wrong.
Notice what changes after that habit becomes automatic. Error messages become evidence rather than obstacles, failures become smaller experiments, and fixes become explanations other programmers can trust. The craft is not avoiding every bug. It is learning to make a computer reveal exactly where your model of its behavior was wrong.