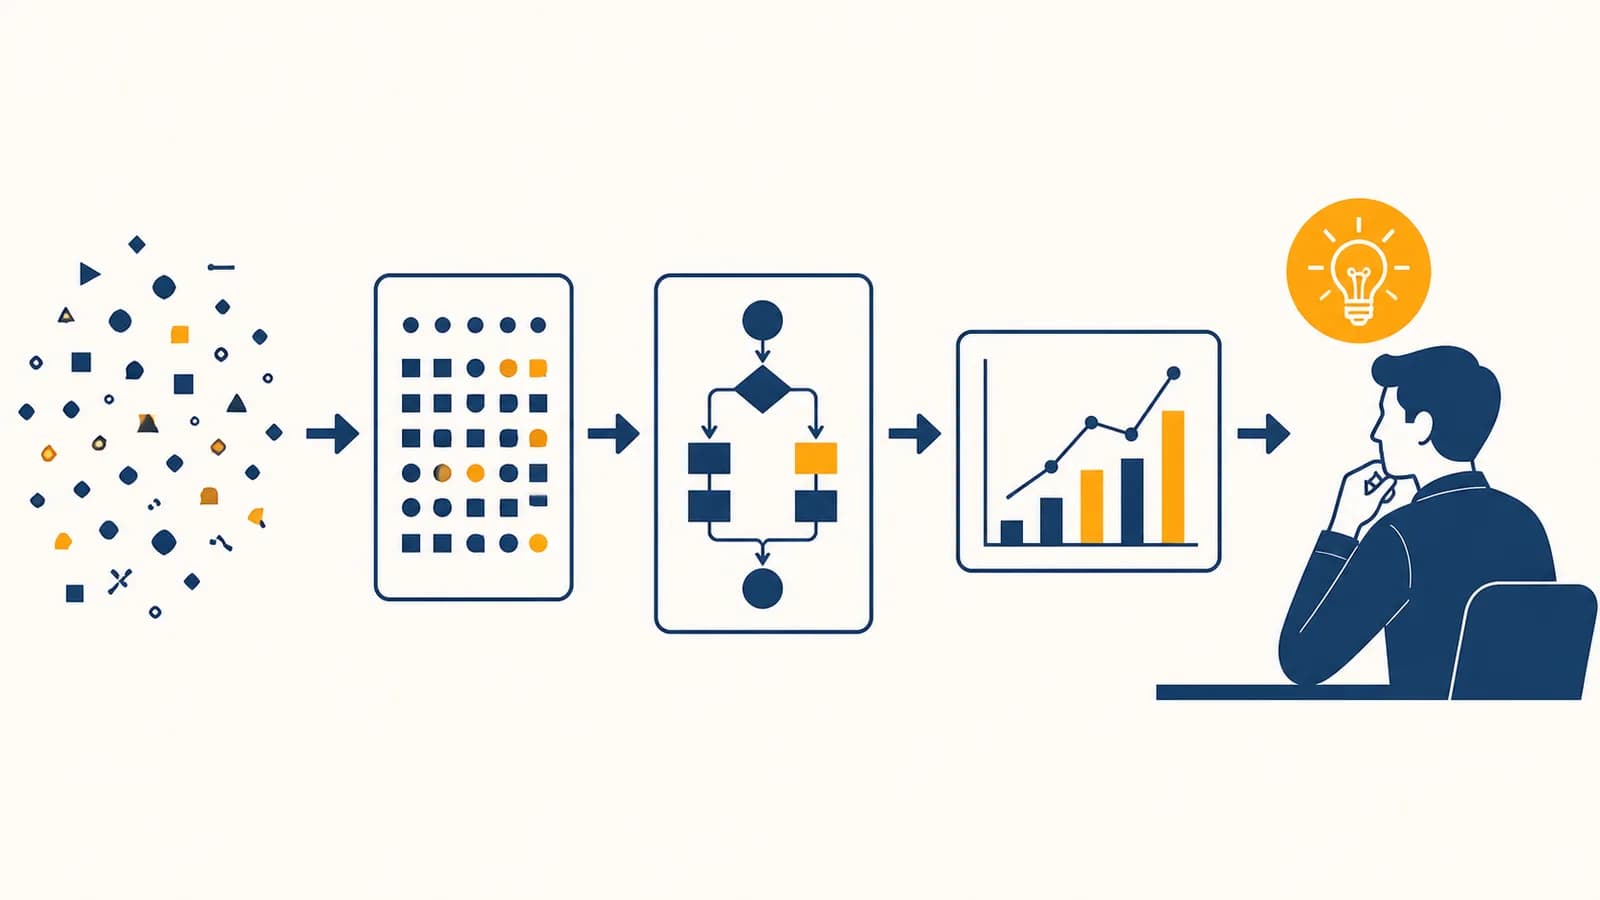
Data science is an interdisciplinary practice that turns raw data into evidence for decisions, in the context of computing, statistics, and a specific field of work. A data science explanation usually covers collecting data, cleaning data, analysing patterns, building models, and communicating results. The practice exists because measurements do not interpret themselves: someone must decide what the records mean, what uncertainty remains, and what action the evidence supports.
A supermarket sees millions of till entries. A hospital records test results and treatments. A city counts vehicles at road sensors. Each collection is data, but none is automatically an answer. Data science supplies a repeatable process for moving from those records to a claim that another person can inspect, challenge, and use.
What data science actually is
Data science is the work of forming answerable questions, obtaining relevant data, testing explanations, and presenting the result with its limits. It combines computational methods with statistical reasoning and subject knowledge, because correct calculations can still answer the wrong practical question.
The word data covers recorded observations. A row might describe one customer order, one patient visit, one weather reading, or one frame from a camera. Columns hold variables such as time, price, temperature, diagnosis, or pixel brightness. Text, sound, images, and network connections also become data once a computer represents them in a consistent form.
The word science signals more than the use of software. A data scientist makes a claim that can be checked against observations. They state how records were selected, how missing values were handled, what comparison was made, and how much uncertainty surrounds the result. Repeating the analysis should produce the same output from the same input.
This flow is a loop, not a one-way factory line. A decision changes the situation, which creates new data. If a bus operator changes a timetable after studying delays, later arrival records reveal whether the change helped. Data science includes that check. Without it, an attractive chart can survive long after its recommendation has failed.
Three kinds of question appear often. Descriptive questions ask what happened, such as which routes were late. Predictive questions ask what is likely next, such as which buses may be late tomorrow. Causal questions ask what would happen under an intervention, such as whether adding a bus would reduce waiting. The same table can support the first question and fail to support the third.
Data is recorded evidence, not reality itself. A database contains what a system was designed to capture. Events outside that design can be absent even when they matter more than the recorded fields.
How raw data becomes usable
Raw data becomes usable through a documented sequence of collection, validation, cleaning, combination, and transformation. Each step protects the link between a real event and its stored representation, so later calculations compare like with like instead of mixing errors with observations.
State what one row represents and what outcome must be explained. “One completed order” is clearer than “sales data,” and “predict next week’s late deliveries” is clearer than “find insights.”
Keep the source, time, method, and permissions attached to the data. A temperature from a calibrated sensor has a different meaning from a value typed into a form.
Check data types, allowed ranges, unique identifiers, units, and category names. A negative age or an order dated before the customer account existed signals a problem to investigate.
Correct known errors, mark missing values, remove exact duplicates when justified, and record every rule. Deleting an awkward observation without a stated reason changes the evidence.
Convert units, group timestamps, calculate rates, or encode categories. Keep the original fields so another analyst can audit or revise the transformation.
Suppose a bicycle rental file stores duration in both minutes and seconds but labels the column simply “duration.” A value of 600 could mean ten minutes or ten hours. No algorithm can recover the intended unit from the number alone. The analyst needs metadata, source documentation, or another reliable field. Cleaning is partly technical work and partly investigation.
Missing data needs similar care. An empty income field may mean that a person refused to answer, the question was never shown, a transfer failed, or the income is genuinely unknown. Replacing every blank with zero asserts that each person had no income. That is a new claim, not a neutral repair.
| Raw value | Possible problem | Defensible treatment |
|---|---|---|
| “London”, “london”, “LONDON” | One city appears as three categories | Standardise case while preserving the original entry |
| 31/04/2026 | The calendar date cannot exist | Flag it for correction or mark it missing |
| Height: 175 | The unit is unstated | Confirm the source unit before conversion |
| Two rows with one order ID | Duplicate order or separate items | Check what a row represents before deleting either row |
Joining tables creates another risk. A customer table may have one row per person, while an orders table has many rows per person. Joining them repeats customer fields once per order. That is correct for order-level analysis, but counting the joined rows as people inflates the customer count. The key question is always, “What does one row mean now?”
How analysis turns evidence into a decision
Analysis turns evidence into a decision by comparing relevant quantities, measuring uncertainty, and connecting the result to an action rule. A useful result states what was observed, what assumptions support the inference, and what consequence follows if the estimate is wrong.
Imagine a support team deciding whether to add staff on Fridays. Over four Fridays it receives 80, 100, 120, and 100 requests. The arithmetic mean is:
The observed average is 100 requests per Friday.
The mean describes the centre of these four observations, but the staffing decision needs more. The values vary by 20 below and above the mean. Four Fridays may not represent holiday periods or product launches. The team also needs service time per request, staff availability, and the cost of delayed replies. A calculation becomes decision evidence only after it is tied to those conditions.
Exploratory analysis looks for distributions, unusual values, relationships, and changes over time. A histogram may show that most deliveries arrive quickly while a small group takes much longer. A scatter plot may show that longer travel distance tends to accompany longer delivery time. These displays help form explanations, but a visible relationship is not automatically causal.
A school tests two reminder messages for an optional revision session. Message A goes to 100 randomly selected students and 40 attend. Message B goes to another 100 and 50 attend. The observed attendance rates are 40% and 50%, a difference of 10 percentage points. The result favours B in this test, but random variation and the cost or tone of each message still belong in the decision.
Random assignment matters in that example because it makes the groups comparable on average. If keen students chose message B themselves, their existing motivation could explain the higher attendance. This is confounding: a third factor affects both the supposed cause and the outcome.
A forecast adds another layer. A model learns a rule from known examples and applies it to cases with unknown outcomes. To test honest performance, analysts hold back some labelled records. The model fits the training data, then makes predictions for the held-back test data. Testing on the same records used for fitting rewards memorisation.
For a yes or no prediction, accuracy can conceal costly errors. If only one transaction in 100 is fraudulent, a model that always predicts “not fraud” is 99% accurate in that constructed example and catches nothing. Analysts separate false alarms from missed cases and choose a threshold based on their consequences.
The model estimates a value, such as a 0.72 probability of late payment. It ranks or describes uncertainty.
The organisation chooses an action, such as requesting a deposit above a stated threshold. Costs, rights, and policy determine that rule.
Keeping prediction separate from decision exposes responsibility. A model does not decide how much inconvenience a false alarm may impose on a person. People set that tradeoff, document it, and monitor the outcome.
Data science versus statistics and machine learning
Data science is a broad practice, statistics supplies methods for learning from variable observations, and machine learning develops algorithms that improve predictive performance from examples. They overlap heavily, but data science also includes data engineering, field knowledge, communication, deployment, and monitoring.
| Area | Typical question | Typical output |
|---|---|---|
| Statistics | How uncertain is this estimate, and what process could explain it? | An estimate, interval, test, or model with assumptions |
| Machine learning | How accurately can a system predict unseen cases? | A fitted prediction system evaluated on held-back data |
| Data engineering | How can data arrive reliably, safely, and in a useful structure? | Pipelines, storage systems, schemas, and quality checks |
| Data science | What evidence can answer the practical question, and how should it change action? | A reproducible analysis, model, experiment, or decision tool |
A company investigating cancelled subscriptions might use data engineering to combine billing and product records. Statistical methods could estimate how cancellation varies with service problems. Machine learning could predict accounts likely to cancel. Data science frames the business question, checks whether those fields are appropriate, selects the methods, and explains what action can reasonably follow.
The areas are not rival job titles with fixed borders. A statistician may write production code. A machine learning engineer may design an experiment. A data analyst may do the most important causal work on a project. The distinctions describe kinds of work more reliably than they describe people.
A supervised prediction model connects this topic to how computers learn patterns from labelled examples. Data science asks additional questions around that model: Who supplied the labels? Do they represent the desired outcome? Will the future population resemble the training sample? What happens after predictions influence behaviour?
This sentence captures why domain knowledge belongs beside mathematics. A farming model needs knowledge of seasons and measurement practices. A medical study needs knowledge of diagnosis, treatment, and patient selection. Subject experts can spot a technically valid variable that has no useful interpretation, or a missing factor that makes the entire comparison unfair.
How data science shows up in real decisions
Data science appears wherever recorded evidence guides repeated choices, including diagnosis support, transport planning, fraud review, stock control, scientific research, and public policy. The visible product may be a forecast or dashboard, while the important work often lies in measurement and evaluation.
Hospitals estimate risk without replacing clinical judgment
A hospital may estimate which patients face a higher risk of readmission so staff can plan follow-up care. The model could use prior visits, diagnoses, test results, and treatment details. Before use, the team must check whether historic records reflect unequal access to care. Fewer recorded visits can mean better health, or it can mean that a patient could not obtain treatment.
Clinical usefulness also differs from predictive accuracy. A modest improvement may matter if it identifies patients who can benefit from a safe intervention. An impressive score may be useless if the required data arrives after the treatment decision. Timing is part of the system.
Retailers forecast demand rather than guess stock
A shop estimates future sales to decide how much stock to order. The data may include past sales, prices, promotions, season, store location, and current inventory. A forecast of 30 loaves does not mean exactly 30 will sell. It describes an estimate around which the buyer weighs waste against empty shelves.
Those values are invented inputs for transparent arithmetic, not market statistics. If ordering one extra loaf risks £1 of waste but running short risks £2 of missed margin, the buyer may rationally order above the central forecast. Change the assumptions and the decision changes. The model supplies an estimate; the loss values express the shop’s priorities.
Cities measure systems that people share
Transport planners combine passenger counts, vehicle locations, trip times, and service reports. They can find crowded periods, unreliable connections, or streets where delays spread through a network. Counts must be interpreted carefully. A quiet stop may indicate low demand, poor service, inaccessible design, or missing sensor data.
Public decisions need more than an overall average. A change that lowers mean travel time could still make one neighbourhood’s service worse. Breaking results down by route, time, accessibility need, or area can expose who gains and who bears the cost. Privacy rules also limit how finely individual trips should be tracked.
Newsrooms test claims hidden inside public data
A journalist may analyse budgets, election results, court records, pollution measurements, or company filings. The work includes finding definitions that changed between years and checking whether a total rose because the population grew. A per-person rate and an absolute count answer different questions.
Text can also become structured evidence. A newsroom might classify thousands of public comments by subject, then manually inspect samples to check the categories. The computational methods behind this connect to how machines represent and analyse human language. Human review remains necessary because sarcasm, context, and ambiguous wording can defeat a neat label.
Scientists separate signal from measurement noise
Laboratories use data science to organise instrument readings, process images, compare experimental groups, and share reproducible results. A measurement pipeline can affect the scientific conclusion. If one microscope setting makes faint cells disappear, an image analysis model cannot count what the camera never captured.
Computer vision can measure shapes, motion, or objects across many images, but its output depends on labels and imaging conditions. The link between pixels and claims is explained further in how visual data becomes machine-readable evidence. In scientific work, calibration and error analysis matter as much as speed.
Five mistakes people make with data
The most damaging data mistakes are treating correlation as cause, trusting a biased sample, leaking future information into a model, hiding variation behind an average, and optimising a metric that does not match the real goal. Each can produce convincing but misleading results.
1. Correlation is treated as causation
Two variables are correlated when they change together in the observed data. That pattern does not show that changing one will change the other. Ice cream sales and sunburn cases may rise together because hot, sunny weather affects both. Banning ice cream would not remove the sunlight.
Causal claims need a design that rules out alternative explanations. Randomised experiments can do this when they are ethical and practical. Observational studies use comparison groups, timing, natural experiments, or explicit causal assumptions, but their limits must stay visible.
2. The sample is mistaken for the population
A sample is the observed subset; the population is the larger group the claim concerns. A survey placed inside a fitness app does not automatically represent all adults. Its respondents have access to the app and chose to answer. More responses reduce random noise, but they do not repair systematic exclusion.
A large biased sample can give a very precise wrong answer. Sample size controls one kind of uncertainty. It does not make an unrepresentative collection method fair.
3. Future information leaks into training
Data leakage occurs when model training includes information unavailable at the moment of prediction. A hospital model designed to predict admission risk cannot use a discharge code added days later. Randomly splitting time-dependent records can also let later patterns influence an earlier forecast.
The test should reproduce real use. If a model will predict next month from all prior months, evaluation should train on earlier periods and test on a later period. Every input must have been available by the decision time.
4. An average hides the distribution
Two groups can share a mean and have very different experiences. Consider travel times of 10, 10, 10, and 50 minutes. Their mean is 20 minutes, but three trips are much shorter and one is much longer. Another set of 20, 20, 20, and 20 has the same mean with no variation.
The bars use the longest trip as 100%, so each 10 minute trip fills 20%. A median, range, percentile, histogram, or set of subgroup results can reveal structure that the mean removes. The right summary depends on the decision.
5. The metric becomes a substitute for the goal
A call centre may target short calls because duration is easy to measure. Staff can improve that metric by ending difficult calls early, even if customers must call again. The number moved in the preferred direction while service became worse.
Good evaluation uses several checks: outcome quality, errors, effects on different groups, and behaviour after deployment. These are not a decorative scorecard. They are defences against a system learning to satisfy the measurement rather than the purpose behind it.
What tools do data scientists use
Data scientists use query languages to retrieve records, programming languages to transform and model them, notebooks or scripts to document analysis, version control to track changes, and charts or reports to communicate results. The tool matters less than reproducibility and fit.
SQL is common for selecting and combining data stored in relational tables. Python and R provide libraries for tables, statistical analysis, modelling, and visualisation. Spreadsheets remain useful for small, visible calculations, especially when a subject expert needs to inspect each row. Problems begin when hidden formulas and manual edits make the process hard to repeat.
A notebook mixes code, output, and written reasoning. It is effective for exploration, but cells run out of order can leave stale results. A production pipeline usually moves stable steps into tested scripts. Version control records changes to code and supports review. Data itself may require separate storage because personal or confidential records should not be copied into a code repository.
Fast iteration, temporary charts, many questions, and visible intermediate results help an analyst discover structure and errors.
Scheduled inputs, automated checks, tests, access controls, logs, and monitoring make a repeated analysis dependable.
Communication tools are part of the technical system. A chart must name its units, time period, population, and source. An interactive dashboard should not imply that every filter creates a valid comparison. A written recommendation should separate observation, interpretation, and proposed action so readers can disagree with one without losing the others.
Good projects also keep a data dictionary. It defines each field, unit, allowed value, source, and update schedule. A column called “active” might mean logged in this week, paid this month, or not formally closed. Without the definition, identical code can support conflicting conclusions.
How much mathematics and coding does data science require
Data science requires enough mathematics to reason about variation, probability, comparison, and model error, plus enough coding to make data transformations explicit and repeatable. The depth varies by role, but clear questions and careful validation matter before advanced techniques become useful.
Start with ratios, percentages, distributions, mean and median, conditional probability, and sampling. Linear algebra supports models that operate on many variables at once. Calculus explains how some algorithms adjust parameters to reduce error. These subjects become easier to learn when attached to a concrete question rather than treated as entrance gates.
Conditional probability is especially important. A test can be accurate in one sense yet produce many false alarms when the target event is rare. The relevant question is often the probability that the event is real given a positive result, not simply the probability of a positive result given the event.
If forecasts miss by 2, 5, and 1 units, the MAE is , or about 2.67 units.
The formula says more than a software function name. For each case, take the absolute distance between the observed value and prediction , then average those distances. Absolute values stop positive and negative errors cancelling. The final unit matches the outcome unit, which makes interpretation direct.
Coding begins with small habits: keep raw data unchanged, give variables meaningful names, write one transformation per clear step, test surprising cases, and set random seeds when an algorithm uses pseudorandom choices. A short script that another person can run is more valuable than a complicated model whose preparation cannot be reproduced.
Record the scheduled and actual arrival times for one bus route using an official data source or your own observations. Define lateness, clean the time fields, graph delays by hour, compare median and mean delay, and write one recommendation with one limitation. Do not collect names or identifying details.
That project practises measurement, cleaning, summary statistics, visualisation, and responsible scope. It also invites the hardest question: would the available evidence support changing the timetable, or does it only describe a short observation period?
How can data science respect privacy and fairness
Data science respects privacy and fairness by collecting only justified information, controlling access, testing unequal errors, documenting intended use, and giving affected people meaningful safeguards. Removing names helps, but combinations of other fields can still identify someone or reproduce past discrimination.
Data minimisation asks for the least data needed for a stated purpose. A café loyalty scheme may need a purchase identifier to award points, but not a customer’s precise location throughout the day. Collecting extra fields “just in case” expands the damage from a leak and makes later uses harder to govern.
Anonymisation is also limited. A table without names may include age, postcode, job, and exact dates. In combination, those details can narrow the possible person sharply. Aggregation, access controls, retention limits, and carefully tested privacy methods may all be needed. The correct protection depends on the data and the threat, not on a single “anonymous” label.
Fairness has several meanings that can conflict. Equal overall accuracy does not guarantee equal false alarm rates. Equal approval rates do not guarantee equal treatment of equally qualified applicants. Teams must state which harm they are measuring, why that definition fits the setting, and what other differences remain.
Sensitive decisions need a path for review. If data contributes to access, assessment, employment, credit, medical care, or legal attention, a person should be able to challenge errors and obtain a meaningful explanation of the process.
Technical checks sit inside a larger system. A fairer prediction model cannot repair a harmful policy by itself. Teams need subject experts, affected communities, security staff, and people responsible for law and governance. The data scientist’s duty is to make assumptions and measured harms visible, not to declare a social question solved by an equation.
How is artificial intelligence changing data science
Artificial intelligence is speeding up code generation, data classification, search, and explanation, while making verification more important. AI can propose transformations or models, but it can invent fields, misunderstand units, leak private data, or produce confident claims unsupported by the source records.
A language model can draft SQL, explain an error message, suggest chart types, or summarise free-text responses. Each output needs a check against the schema and source material. If generated SQL joins customers to orders incorrectly, it may duplicate rows while producing a perfectly polished table.
Generated analysis code also inherits the prompt’s omissions. “Predict successful employees” does not define success, the decision time, or acceptable inputs. Historic promotion labels may encode past management choices rather than future job performance. Faster code does not remove the need to define the target.
AI systems themselves create data science work. Teams evaluate training data, compare model versions, inspect errors, monitor changing inputs, and measure how people respond to generated output. A model that performs well in a benchmark can fail after deployment because users phrase requests differently or rely on it in unexpected ways.
Large neural models extend ideas used in smaller predictive systems, with more parameters, data, and computation. They can learn internal representations from examples rather than relying only on fields designed by a person. For a data scientist, model size does not cancel basic duties such as holding out evaluation data and checking subgroup errors.
Data science makes computer science answerable to evidence
Data science connects algorithms to observed consequences. It asks what a program measures, which patterns it learns, how errors are distributed, and what changes after deployment. That discipline turns computing from code that runs into systems whose claims and effects can be tested.
The subject draws on databases, algorithms, software engineering, networks, security, and human computer interaction. A model needs stored inputs, efficient computation, an interface, protected access, and monitoring after release. Studying how computing systems represent information and shape decisions shows why no data project is only a statistics exercise.
The most useful habit is to pause at every arrow in the pipeline. Ask how the question became a measurable outcome, how events became rows, how rows became variables, how variables became a result, and how that result became an action. Each conversion can introduce an assumption or lose information.
The takeaway: Data science is a chain of accountable choices, not a machine that extracts truth from numbers. Choose a small public dataset, write down what one row means, test one claim, show the uncertainty, and state what the evidence cannot support.
Then watch a decision around you. A price changes, a route is adjusted, a recommendation appears, or a risk flag is raised. Look for the measurement behind it and the feedback that would reveal a mistake. That is where data science becomes visible as computer science in use.