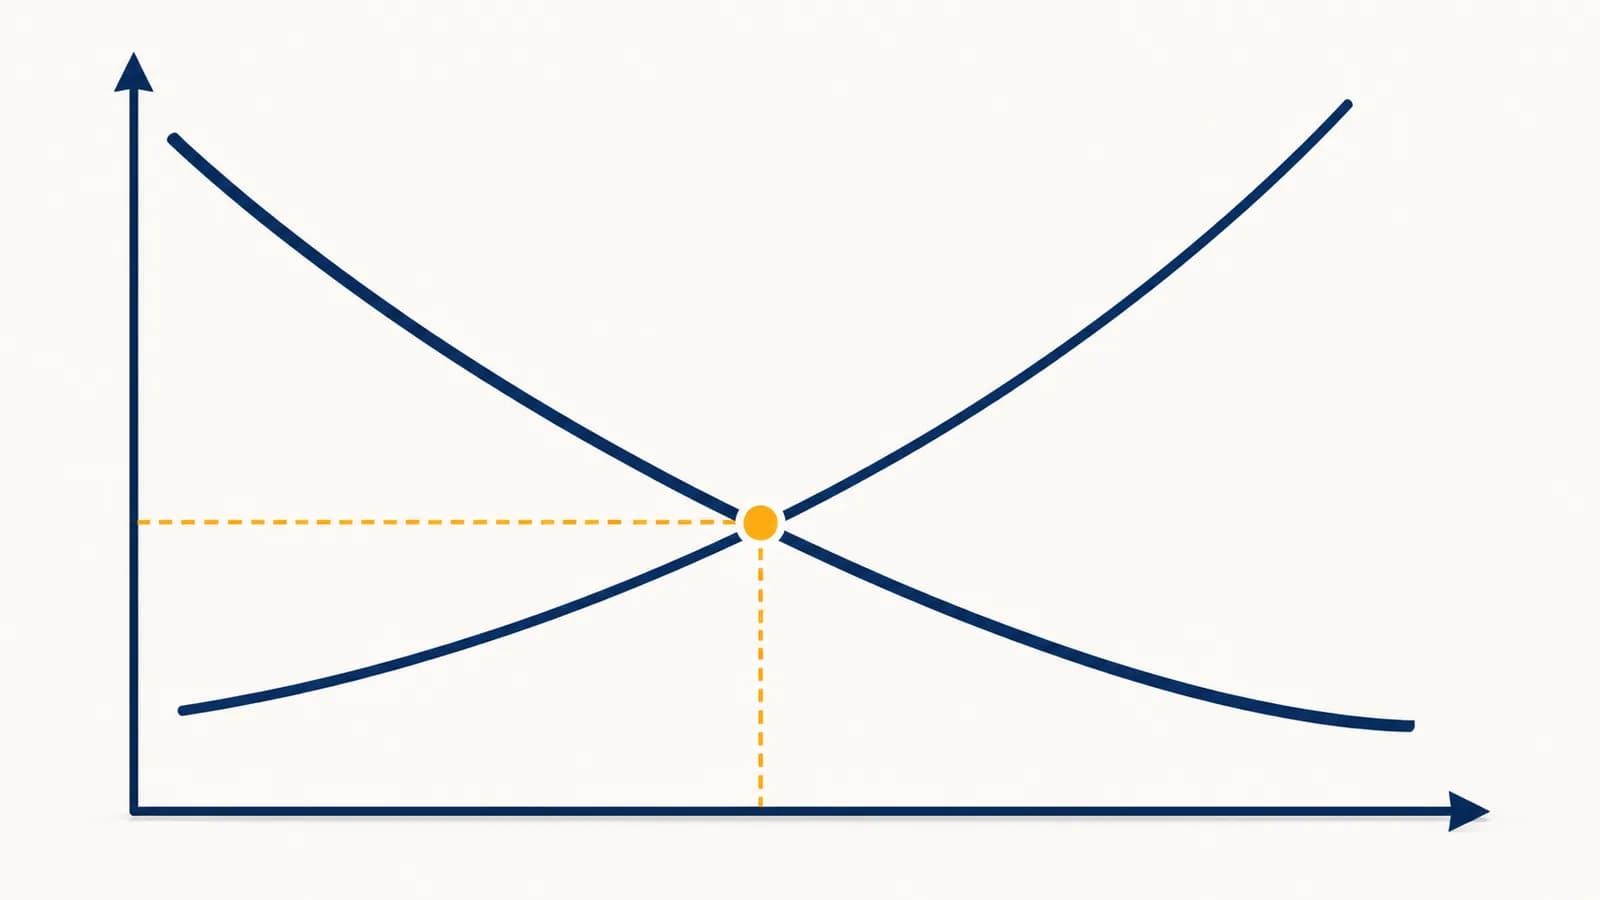
Market equilibrium is a market condition that balances the quantity buyers demand with the quantity sellers supply, in the context of economic exchange. The equilibrium price is the price at which those quantities are equal, and the equilibrium quantity is the amount traded at that price. On a supply and demand graph, equilibrium sits where the two curves intersect. The idea exists because prices help coordinate separate decisions by buyers and sellers, even when no one controls the whole market. A shortage pushes the price upward; a surplus pushes it downward, provided prices can change and competition can occur.
What market equilibrium actually is?
Market equilibrium is the point at which buyers plan to purchase exactly the quantity that sellers plan to offer at the current price. There is no general pressure for that price to rise or fall while the underlying conditions remain unchanged.
The word planned matters. Demand records how much buyers are willing and able to buy at each possible price. Supply records how much sellers are willing and able to sell. Equilibrium matches those plans. It does not require every buyer to receive everything they desire, or every seller to sell any amount they might wish to produce.
Consider a school fundraiser selling reusable bottles. At $8, students want 90 bottles, but the club will supply only 50. The missing 40 bottles form a shortage. At $14, students want 45, but the club will supply 75. The unsold 30 bottles form a surplus. Suppose that at $11, students want 60 and the club supplies 60. Then $11 is the equilibrium price and 60 bottles is the equilibrium quantity.
The figures are not estimates from a real sale. They are a worked schedule whose arithmetic makes the definition visible. At equilibrium, quantity demanded and quantity supplied are both 60, so the planned gap is zero.
Equilibrium is a tendency, not a promise of stillness. Real markets receive new information constantly, so the balance point can move before the price has fully adjusted to the previous change.
How do demand and supply create equilibrium?
Demand and supply create equilibrium through price adjustment. A shortage gives buyers reasons to bid more or sellers reasons to charge more. A surplus gives sellers reasons to cut prices. Adjustment continues until planned purchases equal planned sales.
At a price below equilibrium, quantity demanded exceeds quantity supplied. Some buyers cannot find the product. A shop may see a queue, an empty shelf, or orders arriving faster than stock can be replaced. Buyers compete for limited units, and sellers learn that the current price is leaving possible revenue uncollected. These pressures tend to raise the price.
At a price above equilibrium, quantity supplied exceeds quantity demanded. Goods sit unsold, appointment slots remain open, or homes attract few offers. Sellers may lower prices, offer discounts, reduce future output, or improve the product. Those responses tend to reduce the surplus.
The reverse chain begins with a price above equilibrium, produces a surplus, and creates downward price pressure. Neither chain requires a central official to calculate the correct price. It requires information to reach buyers and sellers, and it requires some way for prices, production, or purchasing plans to respond.
At the current price, identify quantity demanded and quantity supplied.
Demand above supply is a shortage. Supply above demand is a surplus.
A shortage tends to push price up. A surplus tends to push price down.
A new price changes how much buyers seek and how much sellers offer. Continue until the quantities match.
The process can occur through posted prices, private bargaining, an auction, or an online algorithm. It can also work slowly. A supermarket can change a price in minutes, while construction companies may need years to add housing. The speed of adjustment is part of the market's structure, not part of the definition of equilibrium.
How do equations and graphs locate equilibrium?
Equations locate equilibrium by setting quantity demanded equal to quantity supplied and solving for price. A graph shows the same operation visually: the downward-sloping demand curve and upward-sloping supply curve meet at the equilibrium price and quantity.
Use a simple market in which quantity demanded is and quantity supplied is . Here, is price, is the quantity buyers plan to buy, and is the quantity sellers plan to sell.
For this market: .
Solve the equation: subtract 10 from both sides, then add to both sides. This gives , so . Substitute 9 into either original equation. Demand is , and supply is . The equilibrium pair is a price of $9 and a quantity of 55 units.
| Price | Quantity demanded | Quantity supplied | Market condition |
|---|---|---|---|
| $7 | 65 | 45 | Shortage of 20 |
| $9 | 55 | 55 | Equilibrium |
| $11 | 45 | 65 | Surplus of 20 |
On the usual graph, price goes on the vertical axis and quantity on the horizontal axis. Demand slopes down because a lower price usually makes buyers willing and able to purchase more. Supply slopes up because a higher price usually makes additional production worthwhile. These slopes describe movement along curves while other relevant conditions are held constant.
A correct calculation answers two separate questions. The equilibrium price tells you the exchange rate between money and the good. The equilibrium quantity tells you the scale of trade. Reporting one without the other leaves the market outcome incomplete.
Equilibrium price versus a fair price
An equilibrium price balances buying and selling plans, while a fair price reflects a moral or political judgment about who should pay, who should receive, and what outcome is acceptable. One price can satisfy either standard, both standards, or neither.
At what price does quantity demanded equal quantity supplied?
How should benefits, costs, opportunities, and risks be distributed?
Suppose generators can supply electricity during an emergency only at a very high market-clearing price. That price could balance the reduced supply with demand, yet leave low-income households unable to buy enough power. The equilibrium calculation identifies scarcity. It does not settle what rights households have, how hardship should be shared, or whether public funds should cover part of the bill.
The distinction also runs in the other direction. A low agricultural price might clear a market but fail to cover some farmers' costs. Calling the price unfair does not prove that a higher required price will clear the market. If a policy raises the legal price while other conditions stay fixed, buyers may demand less and farmers may supply more, creating a surplus.
Economists can analyze both efficiency and distribution, but they use different evidence for each. Equilibrium analysis follows incentives and constraints. Distributional analysis asks who gains, who loses, and how much income or access each group has. Policy debates become clearer when people do not smuggle the second question into the first.
How do changes in demand or supply move equilibrium?
A change in demand or supply moves the entire relevant curve and creates a new equilibrium. The direction of the price and quantity changes depends on which curve shifted, which way it shifted, and how strongly each side responds.
A price change for the good itself causes movement along a demand or supply curve. A different cause shifts a curve. Demand can shift because income, tastes, population, expectations, or the prices of related goods change. Supply can shift because input costs, technology, taxes, weather, expectations, or the number of sellers changes.
- An increase in demand, with supply unchanged, raises equilibrium price and equilibrium quantity.
- A decrease in demand, with supply unchanged, lowers equilibrium price and equilibrium quantity.
- An increase in supply, with demand unchanged, lowers equilibrium price and raises equilibrium quantity.
- A decrease in supply, with demand unchanged, raises equilibrium price and lowers equilibrium quantity.
Imagine that a popular cooking video makes more people want avocados at every price. Demand shifts right. At the old price, a shortage appears, so buyers compete for the available fruit and price rises. Growers and sellers respond to the higher price by offering more, while some buyers reduce their intended purchases. The market reaches a new equilibrium with a higher price and a larger quantity.
A flour shipment is delayed, raising the bakery's cost per loaf. The bakery supplies fewer loaves at every possible price. At the old price, quantity demanded exceeds quantity supplied. Price tends to rise, quantity sold tends to fall, and the new equilibrium lies up and to the left of the old one.
If both curves shift, one outcome may be clear while the other is uncertain. An increase in demand and a decrease in supply both raise price, so price must rise in the basic model. Demand pushes quantity up, while reduced supply pushes it down, so the change in quantity depends on the relative sizes and shapes of the shifts.
Curve steepness matters because buyers and sellers do not all react equally to price. The study of how responsiveness changes price and quantity outcomes explains why the same supply disruption can produce a large price rise in one market and a modest one in another.
How do price controls prevent a market from clearing?
A binding price ceiling or price floor blocks the price that would equalize quantity demanded and quantity supplied. The result is a persistent shortage under a ceiling or a persistent surplus under a floor, unless another adjustment closes the gap.
A price ceiling sets a legal maximum. It binds only if placed below the equilibrium price. Suppose the equilibrium rent for a type of apartment is $1,200, while a ceiling holds rent at $900. At $900, more households seek apartments and fewer owners offer them. The dollar price cannot rise to remove the shortage.
Scarcity then moves into other forms. Applicants may spend more time searching, join waiting lists, rely on personal connections, accept lower maintenance, or offer prohibited side payments. These responses do not mean a ceiling has no purpose. They mean its full effects include allocation by time, rules, luck, and relationships, not only the posted rent.
“Shortage” does not mean none exists. It means quantity demanded exceeds quantity supplied at the controlled price. Some people still obtain the good, while other willing buyers cannot.
A price floor sets a legal minimum and binds only above equilibrium. If a guaranteed crop price is above the market-clearing level, farms plan to supply more while buyers plan to purchase less. A government can buy the surplus, producers can store it, or output can be limited. Each choice transfers the cost somewhere else.
Taxes and subsidies work differently because they create a gap between the price buyers pay and the price sellers receive. The traded quantity settles where the buyer price covers the seller price plus the tax, or where a subsidy fills part of the gap. The legal side that sends money to the government does not by itself determine who bears the economic burden.
How does equilibrium show up in jobs, housing, tickets, and finance?
Equilibrium appears wherever people exchange scarce goods, services, labor, or financial claims. Wages, rents, ticket prices, interest rates, and asset prices can all coordinate demand and supply, though contracts, rules, market power, and slow adjustment shape the result.
A wage balances labor demanded with labor supplied
In a labor market, employers demand hours of work and workers supply them. A wage above the market-clearing level can attract more applicants than jobs, while a wage below it can leave vacancies unfilled. Skills, location, working conditions, licensing, bargaining, and discrimination divide labor into many connected markets rather than one giant market.
Firms also respond to how much each hour of work adds to output. Output per worker can affect how much an employer is willing to pay, although bargaining power, workplace rules, and labor market conditions influence how the gains from production are divided.
Rent balances households seeking space with owners offering it
Housing supply adjusts slowly because land is fixed by location, planning permission takes time, and construction requires labor and materials. A jump in demand can therefore raise rent sharply before new homes appear. Over a longer period, building and household relocation can make quantity more responsive.
Ticket prices compete with queues and resale
A concert organizer may deliberately set a ticket price below the apparent equilibrium price. Tickets then sell out quickly, and resale prices may rise. The organizer may accept that shortage to reward fans, fill the venue, protect its reputation, or sell related products. A low posted price does not remove scarcity; it changes how tickets are allocated.
You buy a $40 ticket that similar buyers now offer $120 for. The resale market suggests the original price was below the later market-clearing price. Keeping the ticket still carries an $120 opportunity cost, because attending means giving up the chance to sell it for that amount.
In financial markets, buyers and sellers continuously revise orders as news changes expected returns and risk. The market price matches willing buyers with willing sellers at a moment in time. An asset price can clear today's market even when investors disagree sharply about tomorrow, because each trade joins one buyer with one seller at the current price.
Market power changes the seller's decision
A competitive firm treats the market price as given. A seller with market power recognizes that selling more may require a lower price. It may restrict output below the competitive equilibrium quantity to raise profit. The models of how concentrated sellers set price and output explain why an intersection of market demand and competitive supply is not always the observed outcome.
Can market equilibrium exist without an auction?
Market equilibrium does not require an auctioneer or a trading floor. Any system that lets buyers and sellers revise prices, quantities, or offers can move toward balance, including posted-price shops, wage negotiations, online platforms, and long-term supply contracts.
A supermarket posts prices and observes sales rather than asking shoppers to bid aloud. Empty shelves can signal that the price is low relative to current demand and supply. Spoiled inventory can signal the opposite. Managers adjust orders, discounts, and shelf space, while suppliers change production. The feedback is dispersed across many decisions.
Some markets use quantities rather than prices as the fastest adjustment. A restaurant may keep menu prices fixed for months but change portion size, opening hours, or the number of bookings it accepts. A factory may hold its list price steady and build an order backlog. These markets can be out of short-run price equilibrium while other margins absorb pressure.
Prices are messages as well as payments. A rising price tells buyers that a good has become harder to obtain and tells sellers that supplying more may be rewarding.
This information is incomplete. A price does not explain whether scarcity came from a storm, a fashion change, or a production failure. Participants often need other information before choosing a response. Still, the price compresses many separate plans into a signal that can guide action.
Does equilibrium mean everyone gets what they want?
Equilibrium does not mean universal satisfaction. It means that, at the prevailing price, the marginal buyer's willingness to pay meets the marginal seller's willingness to accept, while some potential buyers and sellers choose or are forced not to trade.
A buyer who values a book at $12 will not buy it at an equilibrium price of $15. A seller whose minimum acceptable price is $18 will not sell at $15. Their absence from the transaction is part of the equilibrium, not evidence against it. Plans are conditional on price and purchasing power.
Equilibrium also does not guarantee that every mutually beneficial trade occurs. Search costs can keep buyers from finding sellers. Poor information can hide product quality. Pollution can impose costs on bystanders who are not part of the sale. Market power can reduce output. Economists call these frictions or market failures, depending on their source and effect.
A competitive equilibrium can maximize total gains from trade under demanding assumptions, including informed participants, enforceable property rights, and no unpriced effects on outsiders. It does not choose an equal distribution of those gains. Economic efficiency and social equality are separate measurements.
What happens when equilibrium keeps moving?
A moving equilibrium is a sequence of changing balance points caused by new information, technology, costs, preferences, or policy. Observed prices can chase those points with delays, overshoot them, or remain temporarily fixed while shortages and surpluses accumulate.
Farmers often decide how much to plant before they know the harvest price. If last season's high price encourages many farmers to plant more, the later harvest can create a surplus and push price down. Producers may then plant less, contributing to a later shortage. Delayed responses can produce repeated fluctuations around equilibrium.
Inventories soften some movements. A seller can meet a temporary rise in demand by drawing down stock instead of immediately raising price. When demand falls, the seller can build inventory for later. Storage moves supply through time, linking today's equilibrium with expectations about future prices and costs.
Expectations can move the current market before the predicted event occurs. If coffee traders expect a poor harvest, buyers may seek stocks now and holders may wait to sell. Current demand rises or current supply falls, raising today's price. The expectation may be wrong, but it still changes present behavior.
This is why observed equality between sales and purchases does not prove equilibrium. Every completed sale has both a buyer and a seller as a matter of accounting. Equilibrium compares the quantities all participants planned at the current price, including unsuccessful buyers, unsold goods, withdrawn listings, and unfilled orders.
Five mistakes people make with market equilibrium
Most errors about market equilibrium come from confusing a curve with a quantity, a market-clearing outcome with a desirable one, or a temporary observation with a stable balance. Correcting those distinctions makes graphs, equations, and real cases tell the same story.
1. Treating demand as desire
Demand is not everything people would like to have. It is the quantity they are willing and able to buy at each price during a stated period. A person may need medicine but lack enough income to create effective market demand at the listed price.
2. Calling every price increase inflation
A price rise in one market can result from a local demand increase or supply decrease. Inflation concerns a sustained rise in the general price level across the economy. The distinction is developed in the explanation of how broad price changes differ from individual price movements.
3. Shifting demand because the good's own price changed
If the price of apples falls and other conditions stay fixed, buyers move along the existing apple demand curve to a larger quantity demanded. The curve shifts only when an outside determinant changes, such as income, preferences, population, expectations, or the price of a related good.
4. Assuming a shortage means supply decreased
A shortage describes the gap between quantity demanded and quantity supplied at a particular price. It can occur because a ceiling holds price below equilibrium even when neither curve moves. A decrease in supply is a leftward shift of the entire supply curve.
5. Reading equilibrium as permanent or ideal
An equilibrium lasts only while its determinants remain sufficiently stable, and it describes coordinated plans rather than moral approval. New technology, policy, weather, tastes, or expectations can move it. External costs, unequal income, and market power can make the resulting allocation socially disputed.
The takeaway: Find the price where planned demand equals planned supply, then ask what moved either curve, what prevents adjustment, and who gains or loses. Those questions turn a crossing on a graph into an explanation of a real market.
Market equilibrium turns separate choices into an economic pattern
Market equilibrium connects individual choices to a market-wide result. Buyers compare prices with value, sellers compare revenue with cost, and their combined decisions produce a price and quantity that can change whenever incentives or constraints change.
The model belongs inside economics as a whole because it provides a baseline. It shows what decentralized exchange tends to produce before adding market power, taxes, information problems, external effects, inequality, or public rules. Those additions do not discard equilibrium reasoning. They specify which prices participants face, which costs count, and which responses are possible.
The next time a product sells out, a wage attracts hundreds of applicants, or apartments sit empty, identify the current price and compare the two planned quantities. Then ask which curve moved, what adjustment is blocked, and how long suppliers or buyers need to respond. That habit connects the graph to observable evidence.
For more on the institutions and choices around this model, see how markets fit into the wider study of economics. Market equilibrium is not a verdict that a result is permanent or fair. It is a disciplined starting point for explaining how scarcity becomes a price, a quantity, a queue, or an unsold stock.