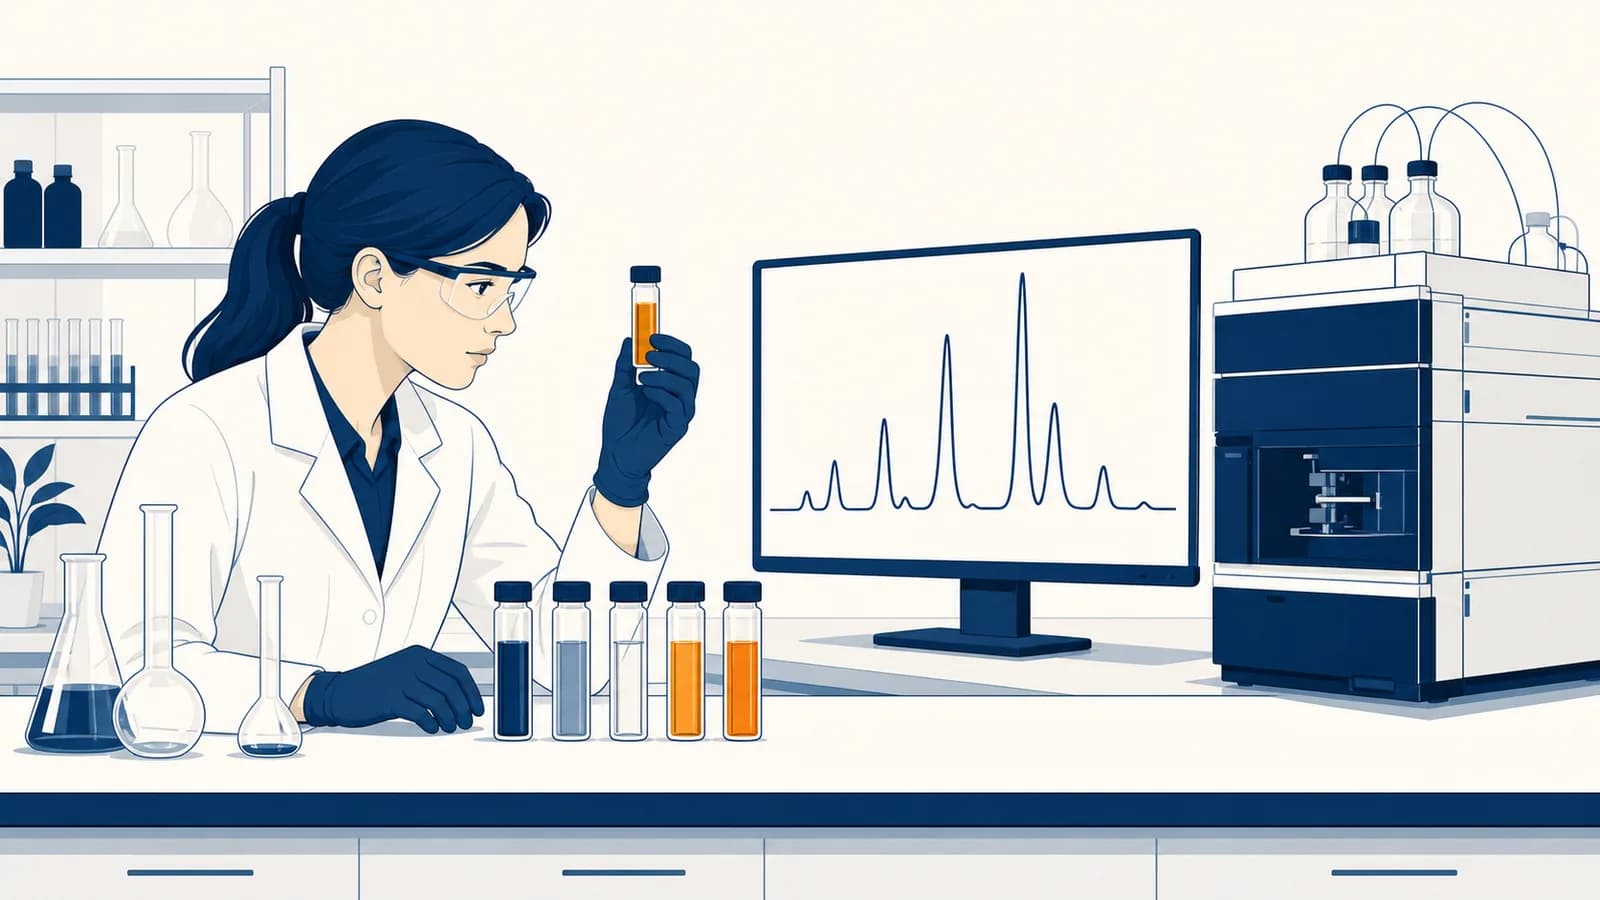
Analytical chemistry is a branch of chemistry that identifies substances and measures how much of each is present, in the context of samples taken from materials, organisms, products, and the environment. It answers two practical questions: what is in this sample, and how much is there? Analytical chemistry methods include titration, chromatography, spectroscopy, electrochemical analysis, and mass spectrometry. They exist because appearance alone cannot reveal purity, concentration, contamination, or chemical identity. A clear liquid might be drinking water, salt solution, or a dangerous solvent, and a reliable answer requires a controlled measurement rather than a guess.
What analytical chemistry actually is
Analytical chemistry is the science of turning a physical sample into defensible chemical information. It includes choosing a representative sample, preparing it, measuring a useful property, comparing the result with standards, calculating an answer, and reporting the uncertainty and limitations.
The field has two closely connected aims. Qualitative analysis establishes identity: it might show that a tablet contains caffeine or that a stain contains iron. Quantitative analysis establishes amount: it might report the caffeine concentration or the mass fraction of iron. Many investigations need both. A number without a secure identity can describe the wrong compound, while an identity without an amount may not answer a safety or quality question.
That chain places analytical work inside the wider study of Chemistry. Ideas about atoms, bonding, reactions, and energy explain why a method responds to one substance and not another. Analytical chemists then turn those ideas into evidence that another person can inspect, repeat, and use.
How qualitative analysis identifies a substance
Qualitative analysis identifies a substance by measuring one or more properties that form a chemical fingerprint. A convincing identification compares the unknown with known standards, checks for interfering substances, and combines independent evidence when a single signal could have several causes.
A simple classroom flame test illustrates both the method and its limits. Sodium compounds can produce an intense yellow flame because excited sodium atoms emit light at characteristic wavelengths as their electrons return to lower energy states. The observation supports the presence of sodium, but it does not prove that sodium is the only element present. A trace of sodium can also mask weaker colors.
The unknown gives a yellow flame. Sodium may be present, but contamination or a mixture could produce the same visible result.
An instrument records emission at several sodium wavelengths, the peaks match a sodium standard, and blank samples show no corresponding signal.
Modern identification often relies on patterns rather than one color. Infrared spectroscopy records which frequencies a molecule absorbs as its bonds vibrate. Mass spectrometry records mass to charge values for ions and fragments. Chromatography records how long compounds take to pass through a column. A match is persuasive when several features agree and plausible alternatives do not.
Selectivity is the method's ability to measure the target, called the analyte, in the presence of other sample components. No method is simply selective or unselective in all circumstances. A detector, separation, chemical reaction, and sample treatment work together. The aim is to make the signal attributable to the analyte instead of to the surrounding matrix.
How quantitative analysis turns a signal into an amount
Quantitative analysis converts a measured signal into concentration or mass by using a known chemical relation or a calibration made from standards. The analyst corrects for sample preparation, dilution, background signal, and uncertainty before assigning the result to the original sample.
In an acid base titration, a solution of known concentration reacts with an unknown. The volume needed to reach the reaction endpoint reveals the amount of unknown through stoichiometry. This is an application of how acid base reactions control pH, but the calculation depends on the balanced equation, not on pH alone.
If 25.00 mL of acid requires 20.00 mL of 0.1000 mol/L base in a one to one reaction, the acid concentration is .
The equality above works only for a one to one reaction. If one mole of analyte reacts with two moles of titrant, the mole ratio must enter the calculation. The endpoint must also correspond closely to the equivalence point, where the reacting amounts have the required stoichiometric ratio. An indicator changes color over a range, so its choice affects the result.
Many instruments measure intensity rather than reaction volume. An absorbance reading, electrical current, or detector peak area becomes useful only after its relation to concentration is established. Analysts usually prepare several standards whose concentrations are known, measure them under the same conditions as the unknown, and fit a calibration line or curve.
These invented teaching data follow the visible relation , where is signal and is concentration in milligrams per litre. An unknown signal of 0.72 gives . The intercept matters: ignoring the background of 0.02 would produce 7.2 mg/L.
Accuracy versus precision
Accuracy describes how close a result is to the accepted or reference value, while precision describes how closely repeated results agree with one another. A method can be precise but inaccurate if a consistent bias pushes every measurement in the same direction.
Imagine a certified reference solution containing 10.00 mg/L of an analyte. Results of 11.41, 11.39, and 11.40 mg/L are tightly grouped, so they are precise. They are also about 1.40 mg/L above the reference, so they are inaccurate. A dirty blank, an incorrect calibration standard, or a fixed volume error could create that bias.
| Result pattern | What it suggests | Useful response |
|---|---|---|
| Tightly grouped and near the reference | Good precision and good accuracy | Confirm routine quality checks remain in control |
| Tightly grouped but shifted | Systematic error or bias | Check calibration, blanks, recovery, and instrument zero |
| Widely scattered around the reference | Random variation | Improve handling and instrument stability, then repeat |
| Widely scattered and shifted | Both random and systematic problems | Do not report until the method is investigated |
Repeatability concerns measurements made under closely matched conditions, such as the same analyst and instrument within a short period. Reproducibility asks how results agree under changed conditions, perhaps across laboratories. Neither guarantees truth by itself. Ten repetitions of a biased method can make the mean look stable without correcting the bias.
Extra decimal places do not create accuracy. A balance reading to 0.0001 g cannot rescue a sample that was poorly collected or a standard whose concentration is wrong.
How sampling controls the quality of the answer
Sampling controls whether a laboratory result describes the material named in the question. The analyst must select enough portions, from suitable places and times, then preserve and mix them so that the test portion represents the larger batch or environment.
A laboratory may measure a tiny test portion with excellent precision, yet the answer can still fail if that portion does not represent the source. Soil varies across a field and with depth. Powder in a large container can separate by particle size. River composition can change after rain. Sampling error often enters before any instrument is switched on.
A factory asks whether a shipment of powdered ingredient meets its specification. Taking one scoop from the top tests that scoop. A sampling plan that selects portions from several positions, combines them, and mixes the composite gives a result that has a defensible connection to the shipment.
Preservation matters after collection. A dissolved metal can adsorb onto a container wall. A volatile compound can escape into the air. Microorganisms can consume nutrients in water. Light can decompose a sensitive molecule. The container material, temperature, storage time, headspace, and any preservative must suit the analyte and method.
Sample preparation then turns the collected material into a form the method can measure. An analyst might dry and grind a solid, dissolve it with acid, filter suspended matter, extract an organic compound into a solvent, or dilute a concentrated sample. Every transfer can lose analyte or introduce contamination, so preparation steps are tested with blanks and recovery experiments.
How calibration and quality control make a result defensible
Calibration establishes the relation between known analyte amounts and instrument response, while quality control checks that the relation remains valid during analysis. Standards, blanks, duplicates, spikes, and reference materials each test a different possible failure.
State exactly what will be measured, in what material, and in what units. “Lead in filtered water, in micrograms per litre” is clearer than “lead level.”
Standards cover the expected range. The blank contains the reagents and follows the procedure without the analyte, revealing background or contamination.
Measure standards and calculate the response relation. Inspect the data rather than assuming that every instrument is linear at every concentration.
Measure a known check standard, duplicate, or reference material as if it were an unknown. A calibration cannot independently verify itself.
Apply dilution factors, assess uncertainty, retain appropriate significant figures, and state any result that falls outside the validated range.
A matrix spike is a real sample with a known added amount of analyte. Suppose the unspiked sample contains 4.0 mg/L, and adding 5.0 mg/L should bring it to 9.0 mg/L. If the spiked result is 8.5 mg/L, the recovered addition is 4.5 mg/L, giving recovery. This test reveals whether the sample matrix suppresses measurement or causes loss during preparation.
Quality control is not paperwork added after the chemistry. It is evidence collected alongside the samples. If the blank is contaminated, a check standard fails, or duplicates disagree beyond the method's limits, the sample numbers need investigation. Reporting them anyway would turn an instrument output into an unsupported claim.
How instrumental analysis turns chemical behavior into signals
Instrumental analysis converts a chemical or physical interaction into an electrical signal that can be recorded. Separation, light absorption, ion motion, electron transfer, or fragmentation provides selectivity, while calibration and quality controls connect the signal to identity or amount.
How chromatography and spectroscopy work together
Chromatography separates mixture components because they move differently between a mobile phase and a stationary phase, while spectroscopy measures how separated or unseparated substances interact with energy. Coupling separation to a selective detector can identify and quantify compounds in complex mixtures.
In gas chromatography, a vaporized sample travels through a coated column in a carrier gas. Compounds that are more volatile or interact less strongly with the coating usually travel faster. In liquid chromatography, a liquid mobile phase pushes the sample through packed particles, and molecular interactions determine retention. The time at which a peak appears helps identify a compound, while peak area often supports quantification.
Spectroscopy supplies another axis of information. Ultraviolet and visible absorption can measure concentration when a molecule absorbs selected wavelengths. Infrared absorption can reveal bond types and molecular structure. Atomic emission can identify elements by their emitted wavelengths. The underlying electronic behavior connects to electron arrangements inside atoms.
Absorbance equals molar absorptivity , path length , and concentration under conditions where the relation is linear.
If path length and chemical conditions stay fixed, absorbance can rise in direct proportion to concentration. Real samples may depart from this simple relation because of very high concentration, chemical equilibria, stray light, or overlapping absorption. Calibration standards should therefore resemble the samples and cover their concentration range.
Mass spectrometry does not weigh intact molecules on a tiny balance. It creates ions, separates them according to mass to charge ratio, and detects them. When attached to chromatography, it receives compounds at different times and records ion patterns for each. Retention information plus a mass spectrum is much harder for an interfering compound to imitate than either signal alone.
How electrochemical analysis measures ions and molecules
Electrochemical analysis measures voltage, current, charge, or conductivity produced by chemical species at electrodes or in solution. The response can reveal ion activity, concentration, reaction rate, or total amount, provided the electrode behavior and sample conditions are controlled.
A pH electrode measures a potential difference related to hydrogen ion activity. It does not count hydrogen ions directly. The glass membrane develops a potential that changes with conditions at its surfaces, while a reference electrode supplies a stable comparison. Calibration with buffer solutions translates the voltage into pH.
Other sensors use ion selective membranes, and voltammetric methods change an applied potential while recording current. A target species may be oxidized or reduced at a characteristic region of potential. The size of the current can relate to concentration, but mass transport, electrode surface condition, and other reacting species also affect it. These methods build on how electron transfer creates electrical signals.
An instrument measures a property, not the conclusion. A voltmeter supplies voltage, a detector supplies response, and the analytical method supplies the tested connection between that response and the reported chemical amount.
Coulometry measures the total electric charge used to complete an electrode reaction. Since charge counts transferred electrons, Faraday's law connects it to chemical amount. This can provide a direct route to quantity when current efficiency is known and side reactions are controlled.
Here is charge, is electrons transferred per analyte particle, and is the Faraday constant.
How analytical chemistry shows up in medicine, products, and investigations
Analytical chemistry supplies measurements used to diagnose disease, release products, monitor environments, investigate evidence, and enforce specifications. The setting changes, but the same chain remains: define the question, control the sample, measure against standards, test quality, and interpret limits.
Clinical laboratories turn specimens into medical evidence
Clinical analysis measures substances in blood, urine, breath, and other specimens to support medical decisions. A glucose assay may use an enzyme that reacts selectively with glucose and produces an optical or electrical response. Calibration converts that response into concentration, while control materials show whether the assay behaved as expected.
The specimen is part of the measurement. Collection time, fasting status, tube type, storage, and breakdown of cells can change results. A reference interval is not a universal border between healthy and ill. It depends on the measurand, method, population, and clinical question, so interpretation belongs with medical context.
Manufacturing laboratories decide whether material meets a specification
Quality control laboratories test raw materials, process samples, and finished goods. A medicine may be checked for identity, active ingredient amount, impurities, dissolution behavior, and stability. Food laboratories can measure nutrients, allergens, additives, oxidation products, or contaminants. A result becomes a pass or fail only after comparison with a stated specification and an appropriate decision rule.
A label claims that each tablet contains a stated amount of active ingredient. The laboratory crushes a defined set of tablets, extracts the compound, separates it from excipients by liquid chromatography, and compares peak areas with standards. Replicates and a recovery check test whether mixing and extraction worked.
Process analysis can also happen during production. A probe may monitor acidity, moisture, or a spectral feature as material flows. Faster feedback can reveal drift before a whole batch is complete, but the online sensor still needs calibration, maintenance, and comparison with an accepted method.
Environmental and forensic laboratories must protect the chain of evidence
Environmental laboratories measure analytes in air, water, soil, sediment, and organisms. The chosen method must suit both the expected concentration and the matrix. Measuring a trace contaminant in seawater is different from measuring the same compound in clean laboratory water because salts and organic matter can interfere.
Forensic analysis can compare glass, fibers, drugs, ignitable liquid residues, inks, or biological material. An analytical result may show that samples are chemically consistent or that a controlled substance is present. It usually cannot, by chemistry alone, establish who placed a material somewhere or when it arrived. Documentation, sealed transfers, blanks, controls, and independent review protect the connection between the physical item and the reported result.
Five mistakes people make with analytical results
Analytical results are often misread by treating detection as proof of danger, confusing precision with truth, ignoring the sample, extending calibration beyond tested limits, or reporting more certainty than the method supports. Each mistake breaks a different link between measurement and conclusion.
1. Treating detected as dangerous
Detection establishes that a signal meets defined identification criteria. Risk also depends on amount, route of exposure, chemical form, duration, and the person or organism exposed. The presence of a substance and the hazard posed by a particular exposure are different claims.
2. Trusting a precise cluster without checking bias
Repeated values can agree because the same faulty calibration affects every one. Independent reference materials, spikes, and blanks test accuracy in ways that repetition alone cannot. Precision is valuable, but it does not certify the target value.
3. Forgetting what the sample represents
A result applies first to the test portion. It applies to a bottle, field, patient, river, or shipment only through a justified sampling process. One clean scoop cannot establish that every part of a mixed batch is clean.
4. Extrapolating beyond the calibration range
A straight calibration line within a tested range may curve or saturate outside it. An overrange sample should usually be diluted and measured again. Extending a fitted line far beyond its standards assumes behavior that the experiment did not establish.
5. Confusing instrument digits with measurement certainty
A display can show many digits even while sample variation, calibration, recovery, or background dominates the uncertainty. Reported figures should reflect the whole measurement process. A result is more honest when it includes suitable units, uncertainty, method, and any relevant reporting limit.
How detection limits differ from zero
A detection limit is the smallest amount that a method can distinguish from background with a stated level of confidence. A result below that limit does not prove that the analyte is absent; it means the method cannot reliably establish its presence at that level.
Every measurement has background variation. Reagent impurities, detector noise, contamination, and random fluctuations can produce small responses without analyte. A detection criterion must separate a likely analyte signal from that distribution. The exact calculation depends on the method and the rules governing its use.
The quantitation limit is usually higher than the detection limit because estimating an amount reliably demands a stronger signal than noticing evidence of presence. Laboratories may also use a reporting limit set by method validation, regulation, or practical sample volume. These terms should not be swapped without checking their definitions.
No signal met this method's identification rule under the stated conditions. A smaller amount may still be present.
The analyte is completely absent. Real measurements almost never establish this unlimited claim.
How destructive and non-destructive methods differ
Destructive methods consume or permanently alter some sample during preparation or measurement, while non-destructive methods leave the tested object substantially intact. The choice depends on required sensitivity, available material, matrix complexity, and the value of preserving the object.
Dissolving a metal shaving in acid for elemental analysis destroys that portion. Burning a sample, digesting tissue, and extracting a tablet can do the same. X ray fluorescence can often examine a solid surface without removing a visible portion, and some optical methods can scan an object directly.
Non-destructive does not mean consequence free or automatically better. A surface reading may not represent the interior, geometry can affect the signal, and radiation or laser light can alter sensitive materials. Museum objects and forensic evidence often begin with non-destructive screening, followed by a tiny sampled analysis if the question demands stronger identification or lower detection limits.
What jobs use analytical chemistry
Analytical chemistry is used by laboratory analysts, forensic scientists, environmental chemists, clinical scientists, toxicologists, quality specialists, process chemists, instrument engineers, and regulatory scientists. Their shared work is to connect a chemical measurement to a decision that someone can defend.
Daily tasks can include receiving and logging samples, preparing standards, maintaining instruments, reviewing chromatograms, investigating failed controls, validating methods, estimating uncertainty, and writing reports. Careful records matter because another person may need to reconstruct what happened months later.
The work rewards practical habits as much as theoretical knowledge. An analyst notices an unexpected color, questions a peak that appears in the blank, labels every dilution, and stops when a control fails. Algebra, statistics, computing, and communication sit beside reaction chemistry because the final product is information, not a vial.
The takeaway: Ask five questions of any analytical result: what substance was targeted, what material was sampled, how the signal was calibrated, what controls passed, and how uncertainty changes the decision.
Analytical chemistry makes chemical claims testable
Analytical chemistry turns the behavior of matter into evidence by linking a defined sample to a selective signal, a calibrated amount, and an honest statement of uncertainty. It is how chemical knowledge becomes usable in decisions about health, materials, products, and environments.
The next time a label gives a concentration, a water report says “not detected,” or a graph shows an instrument peak, look for the measurement chain behind it. Identify the analyte and units. Ask where the sample came from, what comparison standards were used, and which checks could expose contamination or bias.
That habit connects analytical chemistry to the rest of the subject. Reactions explain how tests generate signals, atomic and molecular structure explain spectra, equilibrium controls extractions and sensors, and statistics separates a pattern from noise. Chemistry becomes accountable when a result carries enough evidence for another person to challenge it, repeat it, and decide what it means.