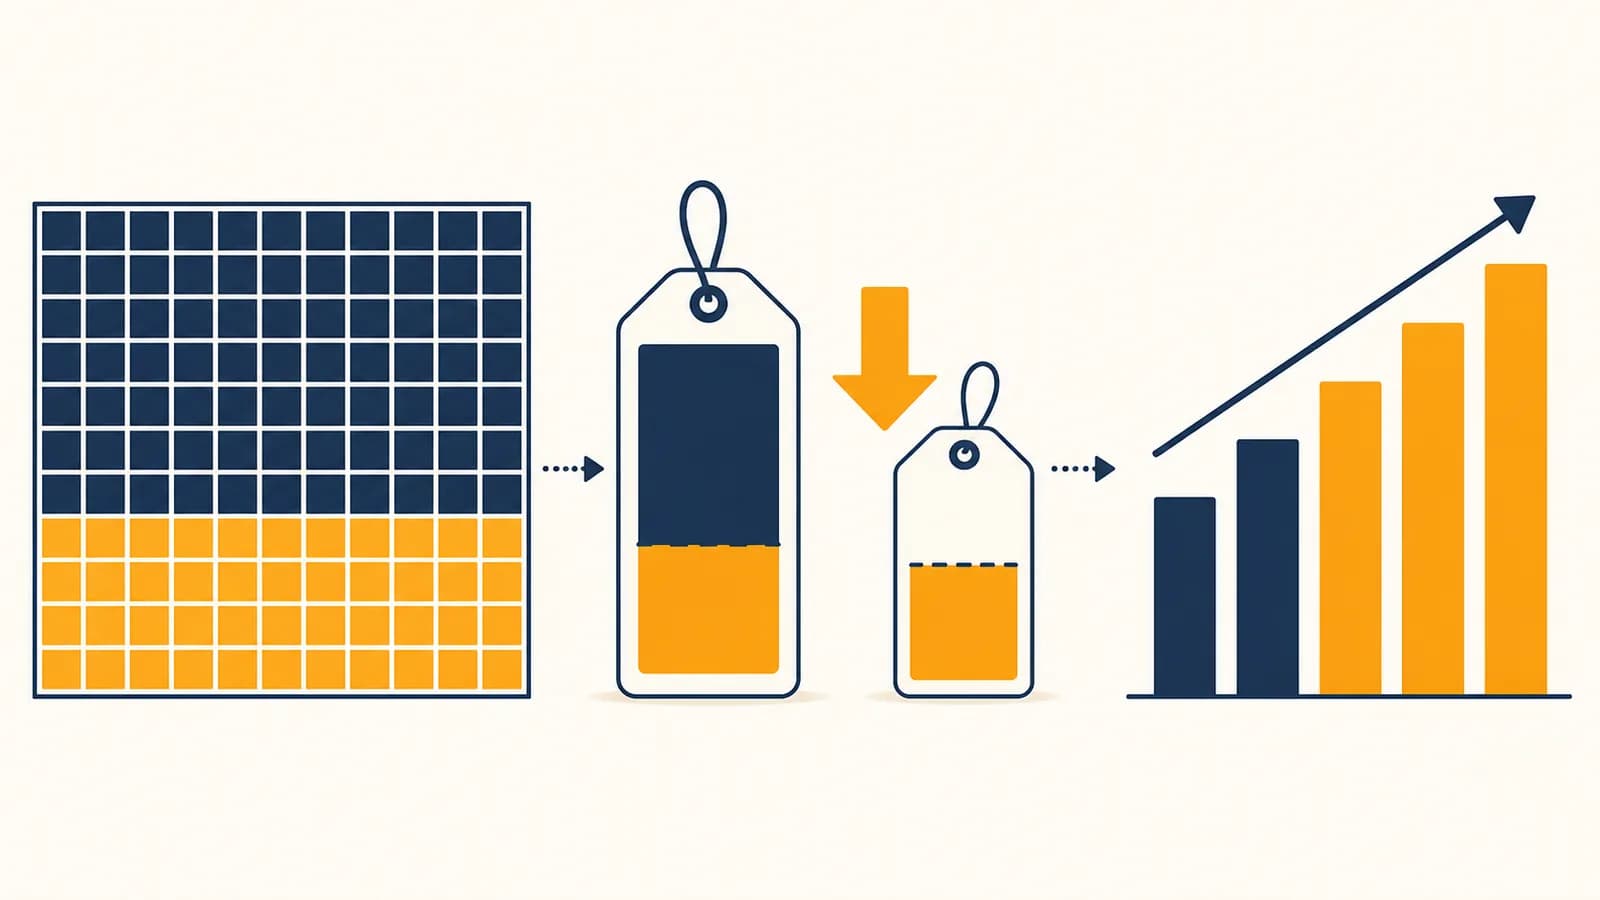
Percentages are ratios that express a quantity as a number of parts per hundred, in the context of comparing amounts and measuring change. A percentage tells you what fraction of 100 an amount represents: 25 percent means 25 out of 100, or one quarter. To calculate a percentage, divide the part by the whole and multiply by 100. Percentages exist because a common scale makes unlike quantities easier to compare. A test score, a shop discount, a tax rate, a bank return, and an election result can all be read on the same per hundred scale.
What a percentage actually is
A percentage is a dimensionless ratio written on a scale whose whole is 100. The symbol % means “per hundred,” so 18% is another way to write 18 divided by 100, the decimal 0.18, and the fraction 9/50.
The word comes from the idea of “for every hundred.” If 18 of 100 seats are empty, 18% of the seats are empty. The same percentage applies if 36 of 200 seats are empty, because both the part and the whole have doubled. What matters is their ratio, not their individual sizes.
If 42 of 60 questions are correct, the score is .
A percentage does not carry a unit of its own. In the fraction “42 questions divided by 60 questions,” the unit questions cancels. The resulting ratio can therefore compare a 70% test score with another 70% score even when the tests contain different numbers of questions.
The whole must still be named. Saying “30%” without saying 30% of what leaves the quantity incomplete. Thirty percent of 20 is 6, while 30% of 900 is 270. The percentage fixes a relationship, not an amount.
These four cards describe one value. Converting among them is a change of notation, not a change of quantity. Fractions and decimal notation make the same relationship visible in different forms.
How percentage calculations work
Every basic percentage problem contains a part, a whole, and a rate. Write the rate as a decimal multiplier, identify which two values are known, then multiply or divide to find the missing value while keeping the whole fixed.
Three closely related questions account for most calculations:
- What percentage is the part? Divide the part by the whole.
- What is a stated percentage of the whole? Multiply the whole by the decimal rate.
- What whole produced this part? Divide the part by the decimal rate.
Find the amount that represents 100%. In “15 is what percent of 60,” the whole is 60.
Find the amount being compared with the whole. Here the part is 15.
Divide part by whole: .
Multiply the ratio by 100 and attach the percent sign: .
The percent sign is not decoration. It divides a number by 100. In a calculation, 7% means . Multiplying 240 by 7 instead of 0.07 makes the answer one hundred times too large.
To find 35% of 80, translate “of” as multiplication:
, so .
To find the whole when 28 is 35% of it, undo the multiplication: . A quick estimate protects against calculator slips. Since 35% is a little more than one third, 35% of 80 should be a little more than 26.7. The answer 28 fits.
Percentages versus percentage points
A percentage measures a share or relative change, while a percentage point measures the arithmetic gap between two percentage rates. A rise from 20% to 30% is 10 percentage points, but it is a 50% increase relative to the original rate.
Subtract the rates: percentage points.
Compare the change with the starting rate: .
The distinction matters whenever the quantities being compared are already percentages. Suppose a loan rate moves from 4% to 5%. The gap is 1 percentage point. Relative to 4%, however, the rate has increased by . Saying only “it rose by 1%” is ambiguous and usually wrong.
News reports, opinion polls, medical risks, and business dashboards often compare rates. Look for the base of comparison. “Two points higher” means subtraction between displayed percentages. “Ten percent higher” means a relative calculation using the earlier or comparison value as the base.
Keep the units visible. A percentage point is a difference between percentages. A percent change is a ratio of the change to the original value.
Consider two classes. In Class A, the pass rate rises from 50% to 60%. In Class B, it rises from 80% to 90%. Both gain 10 percentage points. The relative increases differ: Class A gains 20% of its old rate, while Class B gains 12.5% of its old rate.
How percentages increase and decrease quantities
A percentage change works by multiplying the original quantity by a growth factor. Add the rate to 1 for an increase, or subtract the rate from 1 for a decrease. The original value remains the base for that single change.
If a price of $50 increases by 12%, the increase is , so the new price is $56. The shorter method combines those two operations: . The number 1.12 represents the original 100% plus another 12%.
A 12% decrease uses the factor . Starting with $50 gives . Growth factors make repeated changes especially clear because each new percentage acts on the current amount.
Successive changes multiply
Successive percentage changes do not normally add, because the base changes after each step. A 10% increase followed by another 10% increase multiplies an amount by , producing a total increase of 21%.
Starting with $100 makes the mechanism visible. The first increase creates $110. The second increase is $11 because it is 10% of $110, not 10% of the original $100. The final amount is $121.
Equal increases and decreases do not cancel
An increase and decrease of the same percentage do not cancel because they use different bases. If $100 rises by 20%, it becomes $120. A 20% decrease from $120 removes $24, leaving $96.
The bar lengths use 120 as the visual maximum. The final bar represents 96, which is 80% of 120 and 96% of the original 100. To return from 120 to 100 requires a decrease of , not 20%.
How percentages show up in prices, tax, and interest
Money calculations use percentages to express charges, discounts, returns, and borrowing costs relative to a base amount. The arithmetic is simple only after the base and the order of operations are stated, since different rules may use different bases.
A jacket is marked $80 and discounted by 25%. The discount is , so the sale price is $60. If an 8% sales tax then applies to the sale price, the tax is , making the total $64.80.
Subtracting the 8% tax rate directly from the 25% discount rate to claim a 17% net discount would use the wrong base. The discount acts on $80. The tax acts on $60. Using multipliers gives the full calculation in order: . Relative to the original price, the final reduction is .
Simple interest uses the starting principal
Simple interest calculates each period’s interest from the original principal. For principal , annual rate written as a decimal, and time in years, the interest is .
At 5% simple annual interest, $600 produces dollars per year. Over three years, the interest is $90 and the total is $690. This is a worked mathematical example, not a quoted bank offer.
Compound change uses the current balance
Compound growth calculates each period’s change from the balance at that time. With one compounding step per period, . A $600 example growing 5% annually for three years gives , or $694.58 when rounded to cents.
The extra $4.58 compared with simple interest comes from earning a return on earlier returns. Loans, savings, inflation, and depreciation can all involve repeated percentage change, although real contracts may include fees and compounding schedules that must be read separately. the methods for interest, loans, and inflation extend this multiplier idea.
This asymmetry appears in investment charts and stock headlines, but it is pure arithmetic rather than a special financial rule. Once the base falls, a larger relative gain is needed to recover a fixed amount.
How percentages show up in data, probability, and risk
Data reports use percentages to compare counts across groups of different sizes, while probability uses them to express how often an outcome is expected on a hundred scale. Both require a clearly defined group, event, time period, and denominator.
Suppose 18 of 30 buses arrive within a stated five minute window on Monday, while 45 of 60 do so on Tuesday. Raw counts make Monday look worse because fewer buses arrived on time, but the percentages reveal the comparable rates:
| Day | Within the window | Total observed | Percentage |
|---|---|---|---|
| Monday | 18 | 30 | |
| Tuesday | 45 | 60 |
The result only describes these observations under that definition of “within the window.” It does not by itself prove what all future buses will do. Sample size, selection, missing records, and changing conditions affect what can be inferred.
The denominator tells you what population the claim describes
A sentence such as “40% preferred option A” is incomplete until the denominator is clear. Was it 40% of people invited, people who answered, valid responses, or all eligible voters? Changing the denominator can change the percentage without changing any person’s answer.
Imagine 200 people are invited to answer a poll. One hundred respond, and 40 choose A. Option A has 40% of responses, but only 20% of everyone invited. Both calculations are arithmetically correct. They answer different questions.
Probability percentages describe models or evidence
A probability of 30% means a model assigns an event a chance of 0.30. It does not promise exactly 30 occurrences in every 100 trials. Short runs vary. Under stable repeated conditions, observed proportions may settle nearer to the model probability as the number of trials grows.
Risk statements need the same care as other percentage claims. A change from a 2% risk to a 3% risk is an increase of 1 percentage point and a relative increase of 50%. The absolute figures show how many cases the rates represent; the relative figure shows the size of the change compared with the old rate. the connection between probability and counting explains how those chances can be built from possible outcomes.
Ask for the denominator. A percentage can be calculated correctly and still mislead if the whole, the time period, or the measured event is hidden.
Percentages also need raw counts when group sizes differ greatly. If one problem occurs in a group of two, the rate is 50%. If 40 problems occur in a group of 1,000, the rate is 4%. The first rate is higher, while the second group contains more total problems. Which fact matters depends on the decision.
Five mistakes people make with percentages
Most percentage errors come from using the wrong whole, treating the percent sign as a label, adding changes that should multiply, confusing points with relative change, or reporting more precision than the data can support. Each error can be caught by naming the base.
1. Using the part as the denominator
The denominator must be the quantity defined as 100%. If 12 of 30 employees cycle to work, the cycling percentage is . Dividing 30 by 12 answers a different question and produces 250%, which cannot be the share of employees in this case.
2. Multiplying by the written percent number
A rate must be divided by 100 before it acts as a multiplier. Fifteen percent of 60 is , not . A useful check is that 15% is less than half, so the result should be less than 30.
3. Adding successive percentage changes
Repeated changes act on changing amounts, so their growth factors multiply. A 30% discount followed by a 10% discount gives of the original price. The total discount is 37%, not 40%.
4. Confusing a percentage with a percentage point
If a completion rate moves from 40% to 44%, it rises by 4 percentage points. Relative to the old 40% rate, it rises by . State which measurement you mean.
5. Rounding before the calculation is finished
Early rounding can accumulate error. If a multiplier is 1.075 and it is applied three times, keep the full calculator value of until the final step. Round money to cents or measurements to an appropriate precision only when the result is ready to report.
This sentence is a practical test for every calculation on the page. Point to the 100% quantity. If you cannot, the setup is unfinished. Once the whole is explicit, estimating the likely size of the answer provides a second check.
How reverse percentages recover an original amount
Reverse percentage calculations find the original amount by dividing the final amount by its growth factor. They undo a completed increase or decrease, so subtracting the displayed percentage from the final amount gives the wrong base in most cases.
Suppose a price after a 20% increase is $72. The $72 represents 120% of the original, or 1.20 times the original. Therefore:
For a 20% increase, .
Subtracting 20% of $72 would give $57.60, not $60, because 20% of the final amount is larger than 20% of the original. To check the division, increase $60 by 20%: .
For a decreased amount, divide by a factor below 1. If a sale price of $51 follows a 15% discount, it represents 85% of the original. The original price is . Adding 15% of $51 would produce $58.65 and would not reverse the sale.
How percentages above 100 and below zero work
A percentage may exceed 100% when a part is larger than its chosen whole, and a percentage change may fall below zero when a quantity moves in the opposite direction. The context determines whether either result is meaningful or possible.
If a factory plans to make 80 units and actually makes 100, its output is of the plan. This means the actual output equals the full plan plus another 25% of the planned amount. It does not mean 125% of a fixed container is occupied.
Some shares cannot exceed 100%. No more than 100% of the students in a class can be present, provided each student is counted once and the enrolled class is the whole. Other comparisons have no such ceiling. A city could receive rainfall equal to 140% of a chosen monthly reference amount because rainfall is being compared with a benchmark, not fitted inside it.
A negative percentage change signals a decrease. If a quantity changes from 50 to 40, then . In ordinary reporting, people often say “a 20% decrease” instead of “a change of negative 20%.” A negative percentage of a physical total may be meaningless, but a negative rate of change can be perfectly valid.
How percentage error measures disagreement
Percentage error compares the size of a measurement error with an accepted or reference value. Subtract the reference from the measured value, take the absolute value when only error size matters, divide by the reference, then multiply by 100%.
A measurement of 49 cm against a 50 cm reference has error.
The absolute value reports magnitude without direction. If direction matters, use a signed relative error: , showing that the measurement is low. The reference belongs in the denominator because it defines the comparison scale.
Percentage error is undefined when the reference value is zero, since division by zero has no value. In that situation, report the absolute difference or choose another justified scale. This limitation is mathematical, not a calculator fault.
Percentages connect comparison to the rest of mathematics
Percentages turn multiplication, division, fractions, and ratios into a common language for comparison. Their real power comes from tracking the whole, translating rates into multipliers, and checking how a change of base alters the meaning of every result.
A ratio compares two quantities. A fraction records division. A decimal writes the quotient in place value. A percentage scales that same quotient so the comparison is made per hundred. the methods for ratios and proportional reasoning show why equivalent fractions preserve a percentage when both quantities scale together.
The subject grows outward from the same mechanism. Algebra solves for an unknown part or whole. Exponents describe repeated percentage growth. Statistics asks which population belongs in the denominator. Probability turns chances into proportions. Graphs show rates changing over time. You can place these connections beside the wider collection of mathematics explanations.
The takeaway: Before accepting or calculating any percentage, identify what counts as 100%, convert the rate to a multiplier, and check the result against a rough estimate. Then notice where the base changes, because that is where the interesting mathematics begins.
The next time a receipt, poll, payslip, report, or advert gives a percentage, write its denominator in words. Decide whether it describes a share, a change, or a comparison with a benchmark. That small habit turns a familiar symbol into a precise decision-making tool.