




Mathematics makes relationships precise
Mathematics is the study of quantities, structures, patterns, and changes that reveals how relationships follow from stated assumptions, in the context of counting, measurement, prediction, and decision-making. It answers questions such as how much, how fast, what shape, what pattern, how likely, and what must be true.
School mathematics includes arithmetic, algebra, geometry, functions, statistics, probability, and financial mathematics. These are not isolated boxes. They are different tools for turning a situation into a form that can be examined, calculated, and checked. A builder uses geometry and arithmetic to set out a staircase. An epidemiologist uses functions and statistics to study how a disease spreads. A court may examine probability when evidence involves DNA or sampling.
A mathematical solution usually begins by choosing what to represent. A letter might stand for an unknown cost, a coordinate pair for a location, or a distribution for a set of measurements. Rules then connect those objects. Calculation produces a result, and interpretation brings that result back to the original situation.
The check matters because a correct calculation can answer the wrong question. If a map scale is read in centimetres but the answer is reported in kilometres, the unit conversion is part of the reasoning. If a model assumes constant growth while the real system has a limit, the algebra can be flawless and the prediction can still fail.
Numbers turn amounts into comparable facts
Numbers answer questions about quantity, order, and size, while arithmetic gives rules for combining and comparing those quantities. Place value, units, fractions, decimals, percentages, and ratios make the same underlying amount useful in different kinds of problem.
Counting numbers describe whole items. Integers extend them below zero, which is useful for temperatures, debts, and changes in elevation. Rational numbers express one integer divided by another. Decimal notation writes many of those numbers in a place-value system based on powers of ten. Irrational numbers, such as and , cannot be written as an exact fraction of integers.
The four operations are connected. Subtraction reverses addition, and division reverses multiplication when the divisor is not zero. A strong grasp of how the basic operations behave lets a person estimate before reaching for a calculator and notice when a typed result has the wrong scale.
Estimation check: is close to . A calculator result of would therefore signal a misplaced decimal point.
Fractions and decimals are two notations for numbers, not two species of number. The fraction and the decimal name the same point on the number line. The topic of moving accurately between fractional and decimal forms matters in recipes, workshop measurements, medication quantities, and computer displays.
A percentage is a ratio with a denominator of one hundred. It makes comparisons easier when the original totals differ, but the reference quantity must remain visible. A 20 percent fall followed by a 20 percent rise does not return to the starting value: . The methods behind percentage change and percentage points prevent common errors in sale prices, election reports, and test results.
Ratios describe relative amounts. If paint is mixed in a blue to white ratio of , every group of five equal parts contains two blue parts and three white parts. Scaling to ten parts gives four blue and six white. This multiplicative thinking is developed through rates, scale factors, and proportional relationships.
Algebra turns known relationships into solvable statements
Algebra uses symbols to represent numbers and operations, allowing one relationship to cover many cases or an unknown value to be found. Its power comes from preserving equality while expressions are rewritten, rather than from moving letters by memorised tricks.
An expression such as names a quantity. An equation such as makes a claim that is true only for certain values of . Solving the equation means finding those values. Subtracting five from both sides and dividing both sides by three preserves the balance, giving .
For , both and give .
Laws such as the distributive law justify algebraic steps. They explain why like terms can be collected and why brackets can be expanded. Learning how equations and expressions preserve meaning is more reliable than remembering that a term changes sign when it crosses an equals sign. Nothing literally crosses the sign; the same operation is applied to both sides.
Exponents compress repeated multiplication: means five factors of two and equals . Exponent laws follow from that definition. For example, for a shared nonzero base because the factors combine. The rules for working with powers and scientific notation let very large and very small quantities stay readable.
Roots reverse powers. The principal square root is because . An equation such as , however, has two real solutions, and . Logarithms reverse exponentiation in another direction: because . Roots answer “which base produced this power?”, while logarithms answer “which exponent produced this result?”
Geometry and trigonometry measure space
Geometry studies position, shape, length, angle, area, and volume, while trigonometry connects angles with ratios of side lengths. Together they turn spatial constraints into measurements that surveyors, designers, machinists, navigators, and medical imaging systems can calculate.
Geometric reasoning starts with defined objects and stated properties. Parallel lines never meet in Euclidean geometry. A circle is the set of points at a fixed distance from its centre. Congruent shapes have the same size and shape, while similar shapes have equal corresponding angles and proportional corresponding sides.
Formulas record relationships, but units reveal what is being measured. A rectangle with side lengths and has area , not . A box with three measured dimensions has cubic units because its volume counts unit cubes.
A ramp rises over a horizontal run of . Its gradient is , or . The actual ramp length comes from the Pythagorean theorem: .
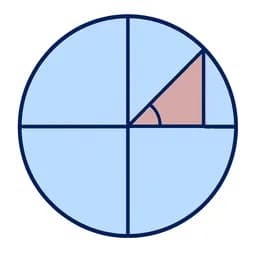
Trigonometric ratios connect an acute angle in a right triangle to pairs of sides. For an angle , is opposite over hypotenuse, is adjacent over hypotenuse, and is opposite over adjacent. The methods in using triangle ratios to find missing lengths and angles support surveying, construction, astronomy, and graphics.
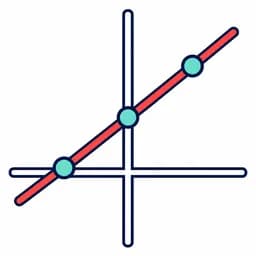
Coordinates join geometry to algebra. A point becomes an ordered pair, a line becomes an equation, and distance becomes a calculation. This translation lets software store shapes as numbers and lets equations describe paths, boundaries, and intersections.
Functions describe how one quantity changes with another
A function assigns exactly one output to each permitted input, making dependence precise. Formulas, graphs, tables, and verbal rules can represent the same function, and each representation reveals different facts about rate, direction, limits, or repeated pattern.
Consider a taxi fare with a fixed starting charge and a constant price per kilometre. If the starting charge is currency units and each kilometre adds , the rule is . The input is distance, and the output is total fare. The coefficient is the rate of change; the constant is the value when distance is zero.
| Representation | What it makes easy to see |
|---|---|
| Formula | The operations that connect input and output |
| Table | Exact values for selected inputs |
| Graph | Overall shape, intersections, and change |
| Words | The meaning of variables and assumptions |
A linear function has a constant rate of change and graphs as a straight line. Its common form is , where is the slope and is the vertical intercept. The study of straight-line models and their graphs applies to constant-speed motion, conversion formulas, and costs with a fixed fee.
A quadratic function contains a squared variable and graphs as a parabola. A thrown object's height can be modelled by a quadratic over the period when constant gravitational acceleration is a suitable approximation. Solving equations with squared unknowns finds intercepts, possible dimensions, and times at which a model reaches a chosen value.
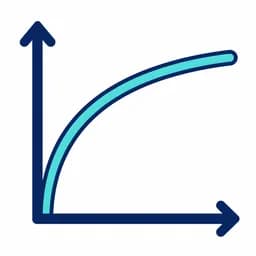
Other functions capture other kinds of change. Exponential functions multiply by a constant factor over equal input intervals. Logarithmic functions reverse exponential functions and compress wide scales. Periodic functions repeat, which suits rotating machinery, sound waves, and seasonal patterns. Choosing the family is a claim about the mechanism, not a cosmetic choice of graph.
Statistics separates pattern from noise
Statistics uses data to describe variation and draw limited conclusions about a wider group or process. It asks what was measured, how observations were selected, how values are distributed, and how much uncertainty surrounds any estimate or comparison.
A data set needs context before calculation. The variable, unit, population, sampling method, and missing observations affect what can be concluded. A large sample collected through a biased process can mislead more confidently than a smaller representative sample. Measuring only people who volunteer for a survey may exclude people whose experiences differ.
For the values , the mean is , while the median is . Neither is automatically better. The mean includes the full total, while the median better describes the central position when one extreme value stretches the distribution. Reading averages, spread, samples, and charts helps a reader decide which summary matches the question.
Correlation measures association, not a demonstrated cause. Two variables can move together because one affects the other, because a third variable affects both, because the sample is distorted, or because chance produced a pattern. A causal claim needs design and subject knowledge in addition to a numerical relationship.
Statistical models do not remove judgement. They make assumptions visible enough to test. A useful report states how data were gathered, shows variation rather than only a central value, and keeps conclusions within the population and time period that the evidence can support.
Probability measures uncertainty, not fate
Probability assigns numbers from zero to one to uncertain events under a stated model, while combinatorics counts the possible arrangements or selections behind many such models. The result describes long-run structure or current information, not a promise about one trial.
For equally likely outcomes, probability is favourable outcomes divided by all possible outcomes. A fair six-sided die has six possible faces, so the probability of rolling an even number is . The assumption that the die is fair is part of the model. Without it, simply counting faces is not enough.
If rain has modelled probability , no rain has probability .
Events are independent when learning that one occurred does not change the probability of the other. Separate rolls of a fair die are modelled as independent. Drawing two cards without replacement is not independent because the first draw changes the deck. The distinction changes whether probabilities can be multiplied directly.
Counting is often the hard part. If three shirts can each be paired with four pairs of trousers, there are outfits. More complicated problems distinguish arrangements, where order matters, from selections, where it does not. Counting outcomes and calculating event probabilities provides the tools for risk analysis, genetics, quality testing, and games.
Conditional probability updates a probability after information arrives. A medical test result, for example, must be interpreted alongside how common the condition is in the tested population and how the test behaves for people with and without it. Ignoring that starting rate can make a rare condition appear far more likely than the evidence supports.
Financial mathematics prices time and tradeoffs
Financial mathematics connects money at different times by modelling interest, inflation, payments, growth, and risk. It answers what a loan will cost, what savings may become, and which assumptions make two offers comparable before a decision is made.
Simple interest is calculated only on the original principal. Compound interest adds each period's interest to the balance, so later interest is calculated on a changing amount. If currency units earn 5 percent per year for two years, annual compounding gives . Simple interest would give .
Convert rates and payment periods carefully. A monthly rate cannot be compared directly with an annual rate.
Record deposits, repayments, fees, and final balances with their dates and signs.
Check whether rates are fixed, whether returns are guaranteed, and what happens if timing changes.
Inflation changes purchasing power, so an increase in the number printed on an account does not necessarily mean an equal increase in what the money can buy. Discounting reverses compounding to express a future payment as an equivalent value at an earlier time under a chosen rate. That chosen rate reflects an assumption and should never be hidden.
The methods in calculating interest, repayments, and present value support personal budgets, mortgages, pensions, business investment, and public projects. They do not predict markets with certainty. Their job is to make cash flows, timing, and assumptions comparable.
Proof explains why a result must hold
A mathematical proof is a chain of justified statements showing that a claim follows from definitions, accepted premises, and earlier results. Calculation can suggest a pattern, but proof establishes it for every case covered by the claim.
Examples are evidence, not universal proof. Checking that , , and suggests that the first odd numbers sum to . A diagram explains why: each new odd number forms an L-shaped border around the previous square.
Different claims invite different proof methods. A direct proof moves from premises to conclusion. Proof by contradiction assumes the claim is false and derives an impossibility. Mathematical induction proves a starting case, then proves that each case forces the next. A counterexample has the opposite role: one valid case can disprove a universal statement.
One counterexample is enough: the claim “every prime number is odd” fails because is prime and even. A thousand odd prime examples could not prove the claim, but this single case disproves it.
Proof also exposes conditions. The familiar cancellation is valid only when and . Writing the restrictions prevents division by zero from entering unnoticed. In applied work, the closest equivalent is a transparent argument that records definitions, data, assumptions, calculations, and limits.
Computers extend checking but do not make definitions optional. A spreadsheet can repeat a formula across a million rows, yet a mistaken cell reference repeats the mistake. Code, symbolic algebra systems, and calculators are best treated as reasoning tools whose inputs and outputs still require inspection.
Mathematics is commonly mistaken for fast calculation
Mathematics is often misunderstood as a test of speed, memory, or natural talent. In practice, competent work depends more on representing a problem, choosing valid operations, checking assumptions, and explaining why a result answers the original question.
A good mathematician sees the trick immediately, calculates without tools, and never makes mistakes. A wrong answer shows an absence of ability.
Mathematicians try examples, draw diagrams, revise definitions, use software, and check each other's work. An error can identify a false assumption or a step that needs justification.
Speed is useful in a few settings, but it is not the same as depth. A person who pauses to label units, estimate the scale, or test a boundary case may solve the real problem more reliably than someone who performs arithmetic quickly. Written working is valuable because it makes the chain inspectable.
Another misunderstanding treats formulas as commands detached from meaning. The area formula does not say that every number labelled should be squared. It applies when is the radius of a circle and the geometry fits the definition. Meaning determines the formula, not the other way around.
Mathematical models are also mistaken for exact copies of reality. A model deliberately leaves things out. A constant-speed model ignores acceleration; a financial model may hold an interest rate fixed; a statistical model may assume observations are independent. A model is useful when its simplifications fit the question closely enough and its limits are reported.
A correct answer includes the conditions under which it is correct. This standard changes how mistakes are handled. Instead of hiding an abandoned approach, a learner can ask which definition was missed, which operation changed the relationship, or which assumption failed. The correction then becomes reusable knowledge rather than a mark on one exercise.
Mathematics connects evidence across school subjects
Mathematics supplies a shared language for quantities and relationships across science, computing, geography, economics, and other subjects. Each field provides meanings and constraints, while mathematics helps express a model, derive consequences, compare evidence, and report uncertainty.
Physics uses equations to connect measurable quantities such as force, energy, time, and electric current. Chemistry uses ratios for reaction amounts, logarithmic scales for acidity, and graphs for reaction rates. Biology uses probability in inheritance, statistics in experiments, and functions in population models. The equations gain meaning from the science, which determines what can be measured and which assumptions make sense.
Computer science turns mathematical procedures into algorithms. Logic shapes conditions, combinatorics counts possible states, and coordinates place objects on screens. Data analysis combines code with statistics, but faster computation does not repair biased data or an ill-defined question.
Geography uses scale, coordinates, rates, and spatial statistics to study maps, populations, weather, and movement. Economics uses functions to model relationships and statistics to test claims against data. Financial decisions add interest and discounting. In each case, units and definitions keep a numerical result attached to the thing it claims to describe.
History, civics, and law also require quantitative reading. Census tables, election margins, sentencing data, damages calculations, and expert evidence can influence public decisions. A reader must distinguish a count from a rate, an association from a cause, and a modelled estimate from an observed fact. Language subjects contribute too, because a mathematical argument must state precisely what its terms and conclusions mean.
The connection works in both directions. Mathematics can show what follows if assumptions hold, but subject knowledge decides whether those assumptions fit a bridge, a cell, a market, or a legal case. Good interdisciplinary work keeps both kinds of reasoning visible.
Mathematics is a disciplined way to make claims checkable
Mathematics brings together representation, calculation, proof, modelling, and interpretation so that relationships can be examined rather than guessed. Its branches fit together because numbers describe quantities, algebra states rules, geometry organises space, and statistics handles variation.
A practical mathematical habit is to move deliberately through a problem. Name the unknown, record the given information with units, choose a representation, carry out valid operations, estimate the likely scale, and interpret the result in context. Then test a special case or use a second method when the consequences matter.
No single branch does every job. Arithmetic may settle a bill, algebra may expose the unknown, a graph may reveal change, geometry may encode a constraint, and probability may describe uncertainty. The choice depends on the structure of the question. Moving between words, symbols, tables, diagrams, and graphs often makes that structure visible.
The takeaway: mathematics turns assumptions and relationships into results that other people can inspect, challenge, and reuse. A trustworthy solution shows not only the answer, but also the definitions, operations, evidence, units, and limits that produced it.
This is why mathematics remains useful far beyond an examination. It helps a person compare a loan, read a medical chart, judge a news graphic, plan materials, test software, or question a confident forecast. The lasting skill is not possession of every formula. It is knowing how to build a precise argument and how to check where that argument applies.