What counts as a good IQ score?
A good IQ score is one that answers the question for which the test was given, but on the common scale, 100 is average and scores from 90 to 109 are typically described as average. By the end, you can read an IQ score as a percentile, judge how precise it is, and understand what it can and cannot say about a person.
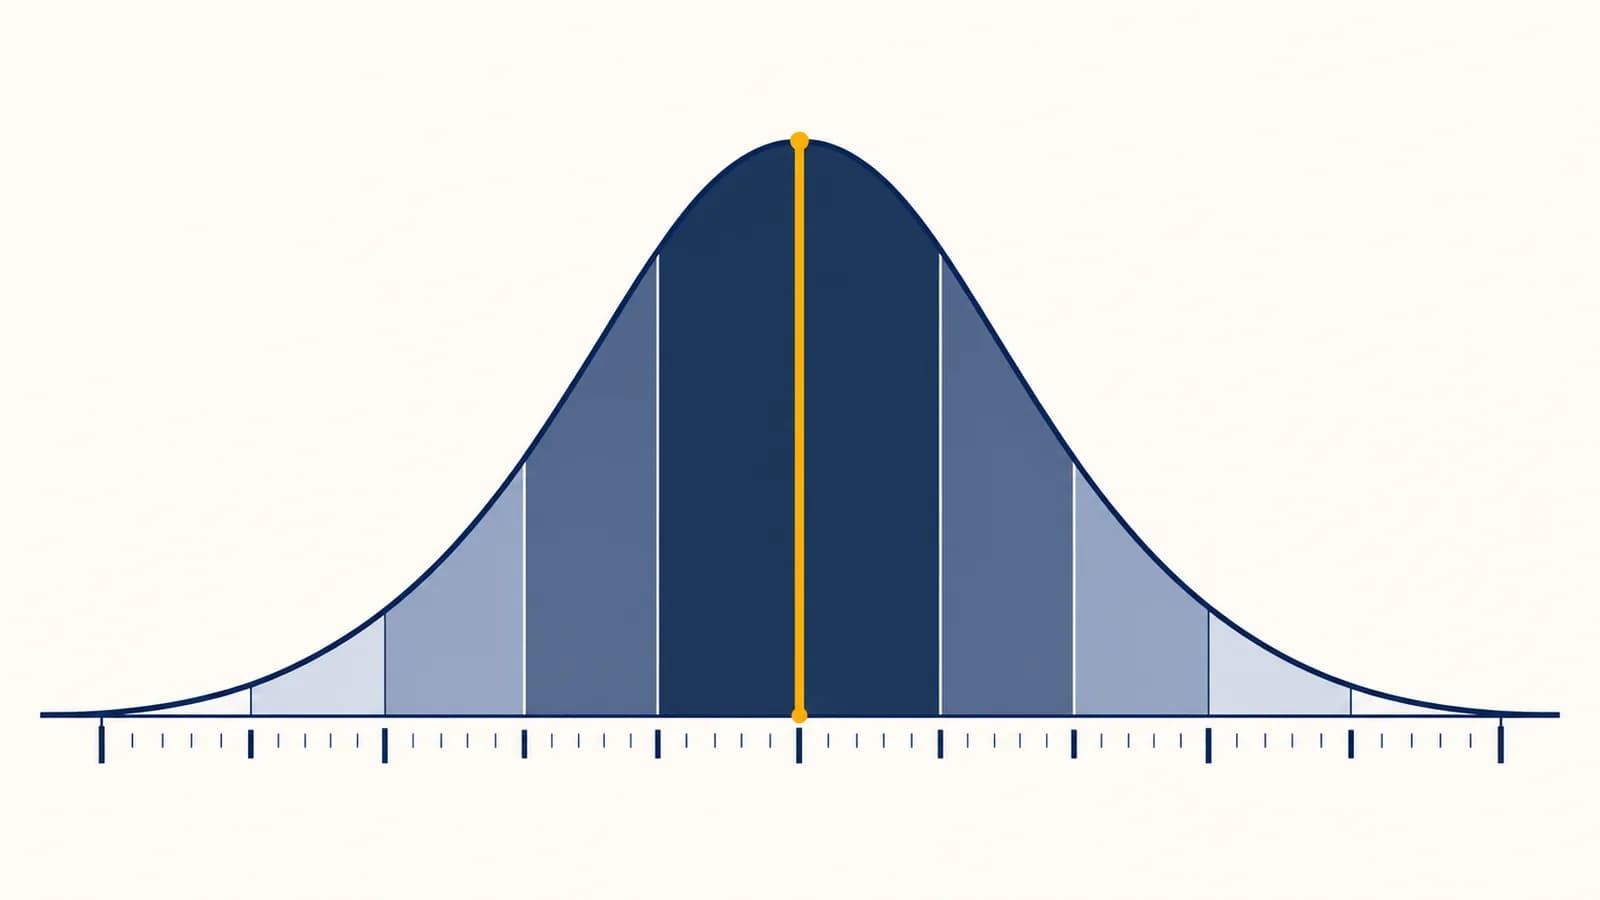
People often use good to mean above average. On a test with a mean of 100 and a standard deviation of 15, 115 is one standard deviation above the mean and sits near the 84th percentile. A score of 130 is two standard deviations above the mean and sits near the 98th percentile. Those are high scores, but they are not universal gates for success, competence, or a satisfying life.
100 is not 100 percent. It is the average standard score in the test's norm group. An IQ of 100 usually corresponds to about the 50th percentile.
The purpose changes the meaning of “good.” A school psychologist may be looking for a pattern that explains why a pupil finds reading or timed work difficult. A gifted education program may be deciding who needs work beyond the usual curriculum. A clinician may be assessing support needs. In each case, the useful result is an accurate profile interpreted with other evidence, not the largest possible number.
These values describe a widely used scoring system, not every test ever published. A report should name the instrument, the edition, the date, and the norm group. A bare number without that information is much harder to interpret.
How are IQ scores built?
An IQ score is a standardized comparison between one person's performance and the performance of a representative group of people of the same age. Test publishers convert correct answers and task performance into a scale designed to have a stated mean and spread.
Modern tests do not usually calculate IQ by dividing “mental age” by chronological age. That historical idea helped give intelligence quotient its name, but current instruments use age based norms. A ten year old is compared with other children of roughly the same age, not with adults or with the entire population.
A test may ask someone to define words, find a visual rule, hold information in mind, or work accurately under a time limit. Raw results are converted into subtest scores. Selected subtests then contribute to index scores and often to a full scale IQ. The manual specifies the conversion, so an examiner does not simply average whatever numbers appear on the page.
The Wechsler Intelligence Scale for Children, Fifth Edition, is a clear example. Pearson's sample interpretive report states that its primary index scores and Full Scale IQ use a mean of 100 and a standard deviation of 15. It also describes 90 through 109 as typically average for that instrument. Other tests can use different scales, so comparing raw IQ numbers across instruments can mislead.
If performance is one standard deviation above the mean, then , so .
The symbol z records distance from the mean in standard deviations. This piece of mathematical reasoning about distributions explains why equal gaps in IQ points have a consistent statistical meaning on the same scale. It does not prove that intelligence itself comes in perfectly equal units.
What does each score range mean?
On a scale with mean 100 and standard deviation 15, scores near 100 are common, while scores become less common as they move farther above or below 100. Percentile ranges give a clearer comparison than flattering or alarming category names.
| IQ score | Distance from mean | Approximate percentile | Plain reading |
|---|---|---|---|
| 70 | 2 standard deviations below | 2nd | Higher than about 2 percent of the norm group |
| 85 | 1 standard deviation below | 16th | Higher than about 16 percent |
| 100 | At the mean | 50th | Near the middle of the norm group |
| 115 | 1 standard deviation above | 84th | Higher than about 84 percent |
| 130 | 2 standard deviations above | 98th | Higher than about 98 percent |
The percentiles are rounded values from the familiar bell shaped normal distribution. Real test norms and score conversion tables may differ slightly, especially near the ends. Use the percentile printed in the official report when one is available.
Category words such as average, superior, or very high depend on the test manual and institution. They can also make a small numerical difference sound like a change of kind. A person with 109 and a person with 110 have nearly identical results, even if a local table places them in adjacent categories.
Why is a percentile more useful than a label?
A percentile states how a score compares with the norm group, while a label compresses that comparison into a broad category. The 84th percentile means the performance equaled or exceeded that of roughly 84 percent of the relevant norm group.
Percentile does not mean percentage correct. Someone can answer 60 percent of items correctly and still receive a high percentile if the items are difficult for the norm group. Another person can answer most items correctly on an easy task and land near the middle. The conversion depends on how other same age test takers performed.
An IQ of 120 means the person got 120 points out of a possible total or is 20 percent more intelligent than someone with an IQ of 100.
On the common scale, 120 places the result about 1.33 standard deviations above the mean. It is a relative position, not a percentage of intelligence.
Percentiles also reveal why a five point difference means something different near the center and near an extreme. Many people cluster around 100, so moving a few points near the mean passes a sizable part of the norm group. Near the upper end, the same point increase passes fewer people because scores are sparse.
A percentile also depends on a sensible comparison group. Age norms prevent a child from being judged against adult performance. Good test design further checks whether the norm sample represents the population for which the test is intended. Language, schooling, disability, and cultural experience still matter when an examiner selects and interprets an instrument.
What can an IQ test measure?
A professionally administered IQ test samples several cognitive abilities, often including verbal comprehension, visual spatial reasoning, fluid reasoning, working memory, and processing speed. It estimates performance on those defined tasks under standardized conditions, rather than measuring every useful human ability.
Fluid reasoning concerns solving unfamiliar patterns and relations. Verbal comprehension draws on language based concepts and acquired knowledge. Working memory tasks require holding and manipulating a small amount of information. Processing speed tasks reward quick, accurate work on simple visual material. Visual spatial tasks involve analyzing shapes and how parts fit together.
These abilities are related, which is why a full scale score can summarize performance. They are not identical. A person may reason very well without working quickly, or know many words while finding visual construction harder. Large differences among index scores can make the profile more informative than the single total.
A pupil earns a high reasoning score but a much lower processing speed score. The full scale result alone hides the contrast. A psychologist can examine the tasks, classroom work, attention, and history to decide whether extra time or a different teaching approach should be considered.
An IQ test does not directly measure curiosity, honesty, persistence, practical judgment, creativity, or knowledge of a particular job. It also does not show that someone will check an answer before acting on it. Work such as finding faults in AI generated code needs domain knowledge, careful testing, and the habit of questioning plausible output.
Knowledge and skill grow through instruction and practice. A test score may help explain how readily someone handles certain cognitive demands, but it cannot substitute for learning. Reading deeply, solving problems, receiving feedback, and correcting errors change what a person can do.
Why can the same person receive a different score?
IQ scores vary because every assessment contains measurement error and because performance changes with health, attention, language, motivation, practice, and testing conditions. A responsible report gives a confidence interval and interprets the result as an estimate, not an exact mental measurement.
If a report gives a score of 112 with a confidence interval of 106 to 118, it is saying that the evidence supports a band of plausible values under the test's statistical model. The exact width depends on the instrument and the chosen confidence level. Pearson's WISC V sample report, for example, presents 95 percent confidence intervals for composite scores.
A score without its confidence interval looks more precise than it is. Treat 112 and 113 as essentially the same unless the test manual and the wider evidence justify a distinction.
Temporary conditions can affect the observed result. Poor sleep can slow responses. Anxiety can occupy working memory. Pain, illness, hearing or vision problems, unfamiliar language, and an uncomfortable room can interfere with task performance. Body systems also affect attention and energy, which makes topics such as hormonal control of the body relevant to cognition without turning an IQ score into a hormone test.
Repeated testing creates another problem. Familiarity with item types and strategies can change performance, especially when tests are repeated too soon. Examiners follow rules about administration and retesting because a comparison is useful only when conditions remain standardized and the norms still apply.
Find the instrument, edition, language, age norms, and date of administration.
Use the reported confidence interval instead of treating the single score as exact.
Compare index and subtest results, while respecting the manual's rules for meaningful differences.
Consider school records, daily functioning, language, health, observations, and the reason for referral.
Online quizzes rarely provide enough information for these checks. A timer, a set of puzzles, and an instant number can be entertaining, but the number is not equivalent to a supervised assessment with published norms, reliability evidence, controlled administration, and professional interpretation.
When does an IQ score matter in school or clinical care?
An IQ score matters when it contributes evidence to a specific decision, such as planning instruction, investigating a learning difficulty, or assessing intellectual functioning. It should be combined with achievement, history, observation, adaptive behavior, and the person's actual needs.
Gifted education illustrates the problem with one cutoff. Mensa uses performance in the top 2 percent on an accepted, properly supervised intelligence test for membership. A school program is different. The National Association for Gifted Children says identification policies are generally set locally and recommends multiple objective and subjective measures rather than letting one test dictate identification.
At the lower end of the scale, an IQ number alone does not diagnose intellectual disability. The American Association on Intellectual and Developmental Disabilities describes the condition as significant limitations in both intellectual functioning and adaptive behavior, beginning during the developmental period. It says a score around 70, or as high as 75 when measurement error is considered, can indicate a significant limitation in intellectual functioning.
The decision changes because a score lands one point above or below a line, even when confidence intervals overlap and daily evidence points elsewhere.
The examiner asks what the score was designed to show, examines uncertainty and score patterns, and combines the test with functioning in real settings.
Adaptive behavior means conceptual, social, and practical skills used in ordinary life. Managing money, communicating needs, following a schedule, staying safe, and caring for oneself are examples. These are assessed in their own right. A high or low IQ score cannot stand in for direct evidence about them.
Workplaces offer a similar lesson. Complex tasks depend on learned knowledge, communication, tools, and error checking as well as reasoning. In software, keeping human judgment in the development process matters because a capable person still needs evidence before trusting an output. The useful question is what someone can do reliably in context and what support improves that performance.
A score is evidence, not identity
A good interpretation treats IQ as one standardized estimate of selected cognitive abilities, tied to a particular test, norm group, date, and purpose. It does not turn a ranking into a verdict on a person's value, future, or right to an opportunity.
Start with the scale. On the common mean 100, standard deviation 15 system, 90 through 109 is typically average, 115 is near the 84th percentile, and 130 is near the 98th percentile. Then check the official percentile, confidence interval, index pattern, and conditions of testing. Those details prevent false precision.
Next, match the evidence to the decision. A classroom plan needs achievement and observation. A clinical evaluation needs developmental and adaptive information. A personal learning goal needs honest feedback about present skills. None of those jobs is completed by a single rank.
The takeaway: An IQ around 100 is average, higher scores mark increasingly uncommon test performance, and no score is meaningful without its scale, percentile, uncertainty, profile, and purpose.
The number can still be useful. It can reveal a pattern, support access to suitable teaching, or help a clinician ask better questions. Used carefully, it is a measurement. Used carelessly, it becomes a label that says far more than the test ever measured.