What does an IQ percentile mean?
An IQ percentile is the percentage of people in the test's norm group who scored at or below a given score. It turns an IQ score into a rank within a comparison group. By the end, you can convert common IQ scores to approximate percentiles, read the rank correctly, and spot claims the number cannot support.
Suppose a report gives an IQ score of 115 and a percentile rank of about 84. The rank means the score was as high as or higher than the scores of about 84 percent of people in the relevant norm group. It does not mean 84 percent of the questions were correct. It also does not mean the person has 84 percent of some maximum possible intelligence.
A result based on how many test items received credit. It describes performance on the item set.
A position relative to other people in a specified norm group. It describes comparative standing.
The comparison group matters because IQ scores are norm referenced. Test developers administer a test to a carefully selected sample, organize the results by age or another relevant characteristic, and build conversion tables. A raw total gains meaning only after it is compared with those norms. A 12 year old and a 30 year old may solve different numbers of items yet receive the same standardized score because each is compared with an appropriate age group.
Percentile ranks compare people, not abilities. The 84th percentile says where a score sits in a norm group. It does not say that the person has 84 percent of all reasoning ability.
How does an IQ score become a percentile?
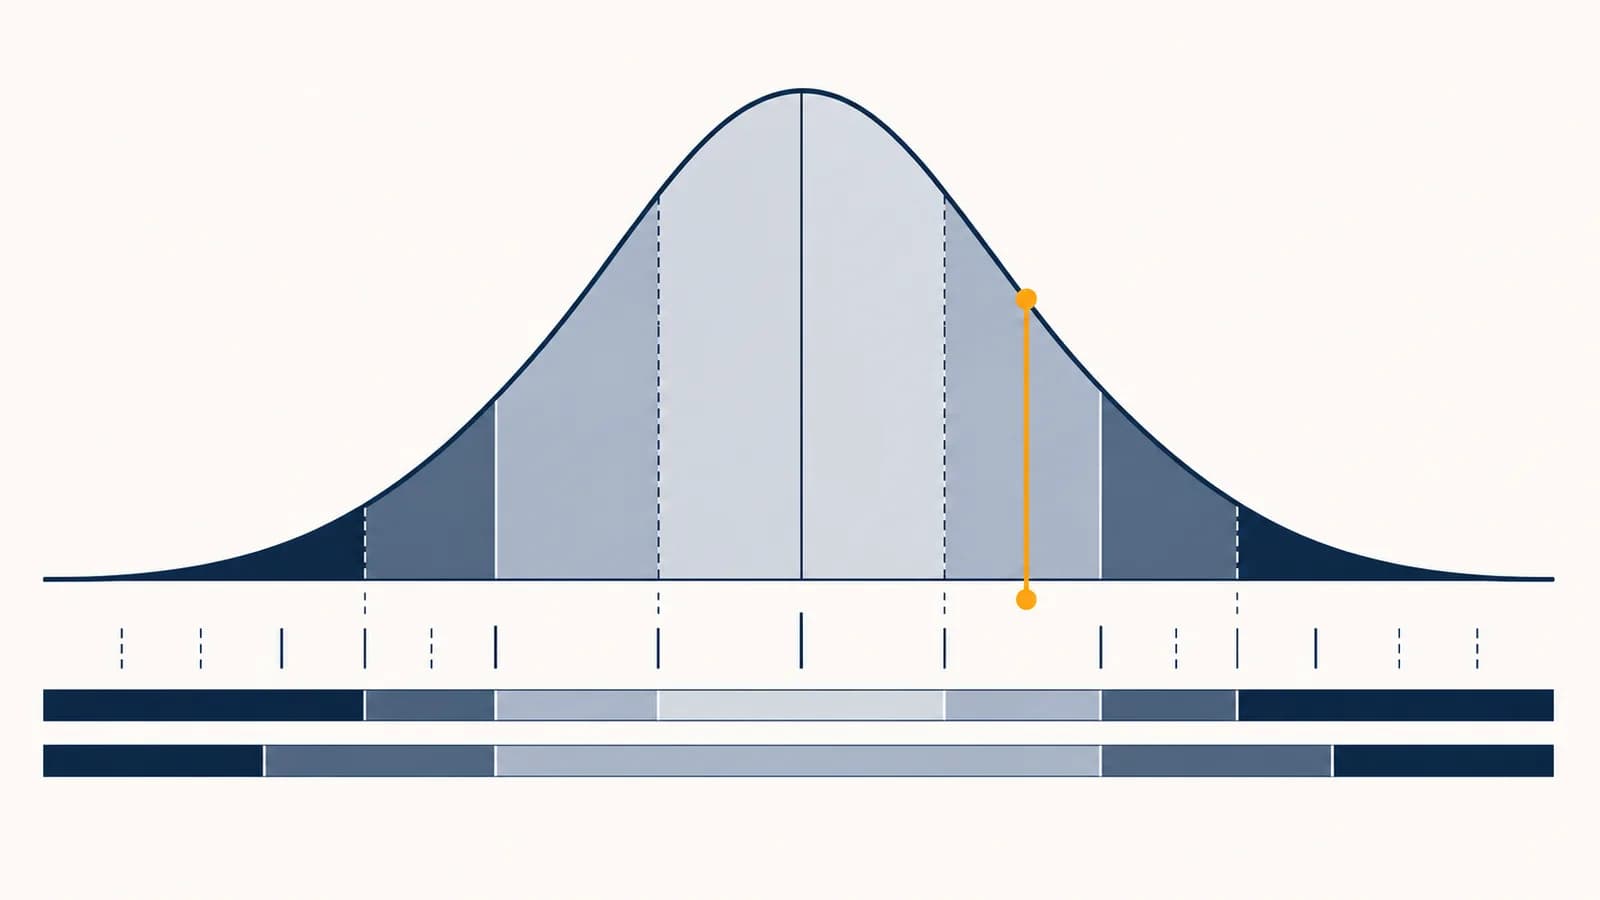
On a common modern IQ scale, the test publisher sets the norm group mean to 100 and the standard deviation to 15. A score is located a certain number of standard deviations from 100, then its percentile is read from the norm distribution or the test's own tables.
A standard deviation measures spread. On the 100 and 15 scale, a score of 115 is one standard deviation above the mean because 115 is 15 points above 100. A score of 85 is one standard deviation below it. The calculation uses the same rearrangement skills taught in school algebra.
For an IQ of 115: .
The z score is a location on a standardized scale. A z score of 0 is at the mean. Positive values lie above it, while negative values lie below it. If the standardized IQ scores follow the expected bell shaped distribution closely, a statistical normal distribution converts that location into a cumulative percentage.
The formula is a useful approximation, not a replacement for a test manual. Publishers may calculate ranks from observed norm data, apply smoothing, or report only whole percentile ranks. Scores near the extremes are especially sensitive to the exact test, its norm sample, and its reporting rules. A professional report should therefore use the publisher's table for that test edition.
Which IQ scores match the common percentiles?
For an IQ scale with mean 100 and standard deviation 15, 100 is the 50th percentile, 115 is about the 84th, and 130 is about the 98th. Equal IQ point steps do not produce equal percentile steps because percentiles follow a bell shaped curve.
| IQ score | Standard deviations from mean | Approximate percentile | Plain language position |
|---|---|---|---|
| 70 | 2 below | 2nd | About 2 percent scored at or below |
| 85 | 1 below | 16th | About 16 percent scored at or below |
| 90 | 0.67 below | 25th | About one quarter scored at or below |
| 100 | At the mean | 50th | Half scored at or below |
| 110 | 0.67 above | 75th | About three quarters scored at or below |
| 115 | 1 above | 84th | About 84 percent scored at or below |
| 120 | 1.33 above | 91st | About 91 percent scored at or below |
| 125 | 1.67 above | 95th | About 95 percent scored at or below |
| 130 | 2 above | 98th | About 98 percent scored at or below |
| 145 | 3 above | Above the 99th | Fewer than 1 percent scored higher |
These are rounded normal curve values. For example, the mathematical cumulative proportion at two standard deviations above the mean is about 97.7 percent, commonly reported as the 98th percentile. Some reports use more precise values, while others use bands. The apparent disagreement often comes from rounding rather than a different interpretation.
Notice how the scale compresses near the ends. Moving from IQ 100 to 115 crosses about 34 percentile points, from the 50th to the 84th. Moving another 15 IQ points to 130 crosses only about 14 percentile points. The IQ intervals are equal, but the percentile intervals are not.
Why are percentile ranks uneven?
Percentile ranks are uneven because people cluster near the average score and become less common toward either extreme. A small IQ difference near 100 passes many people, while the same point difference near a tail passes fewer people. Percentile is rank, not a linear measurement scale.
The shape can be pictured with cumulative bars. Each bar shows the approximate proportion of the norm distribution at or below that IQ score. The bars grow quickly near the center, where scores are crowded, and slowly near the ends, where scores are sparse.
This also explains why subtracting percentiles is risky. A person at the 90th percentile is 40 percentile points above a person at the 50th, but that does not mean the measured difference is four times some 10 point gap. Percentile ranks preserve order. They do not preserve equal distances. An IQ standard score is better suited to describing distance from the mean.
There is another subtlety: percentile rank and percentage above the score point in opposite directions. At about the 84th percentile, roughly 16 percent of the reference distribution lies above. Near the 98th percentile, roughly 2 percent lies above. Those complements add to 100, subject to rounding and rules about tied scores.
How should you read a percentile in a report?
Read the score name, norm group, percentile, confidence interval, and testing conditions together. A percentile is a compact comparison, not a complete diagnosis. The report should make clear which score was ranked, whom it was compared with, and how much measurement uncertainty surrounds it.
Check whether the percentile belongs to a full scale score or to an index such as working memory, processing speed, or verbal comprehension.
Look for the test edition, age band, country or language version, and any special comparison group named in the report.
Use the reported confidence interval when available. It presents a range of plausible values around the observed score.
Consider language, sleep, illness, attention, anxiety, sensory access, familiarity with testing, and any accommodations.
Look at index and subtest results. A single combined score can hide meaningful strengths and difficulties.
A test battery often produces several scores because cognitive performance is not one undivided behavior. A person may reason strongly with visual patterns but work more slowly on timed symbol tasks. Another may understand spoken concepts well but find short term mental storage harder. The full scale result summarizes performance under the battery's rules, while the profile shows how that summary was built.
A school report lists a student's full scale IQ at the 73rd percentile and processing speed at the 21st. Saying the student is simply “73rd percentile intelligent” loses useful information. A teacher may need to separate reasoning demands from copying speed, allow suitable time, and examine achievement data before deciding what support fits.
This is why professional interpretation joins test numbers to classroom records, developmental history, observations, and the question that led to assessment. A percentile may support a decision, but it cannot make the decision alone. The broader habit belongs to mathematical reasoning: identify what a number represents before using it in an argument.
How exact is an IQ percentile?
An IQ percentile is an estimate with several sources of uncertainty. Test performance varies, norm samples approximate larger populations, and score conversions involve rounding. A report may therefore give a confidence interval, and nearby percentiles should not be treated as permanent or sharply different categories.
Reliability describes how consistently a test measures under comparable conditions. No psychological test is perfectly reliable. A person can answer a few items differently because of attention, fatigue, guessing, motivation, or simple variation. The resulting observed score is best viewed as evidence about a range, not as a reading from a perfect instrument.
Do not rank tiny score differences as if they were certain. IQ scores of 108 and 111 may lead to different percentile labels, yet their confidence intervals can overlap substantially. Use the interval supplied by the test report.
The norm sample adds another boundary. A percentile answers, “Compared with whom?” Norms can differ by age, test edition, language, location, and sampling design. Publishers periodically update norms because populations and test familiarity can change. A percentile from an online quiz with an unknown sample is not interchangeable with one from an individually administered, standardized battery.
Extreme ranks also require restraint. A norm sample contains limited numbers of people at the far tails, so the data support fewer fine distinctions there. A result reported as above the 99th percentile does not justify an elaborate claim that one person is exactly a particular number of places ahead in the general population.
What can an IQ percentile tell you, and what can it not?
An IQ percentile can describe relative performance on the cognitive tasks sampled by a particular test under particular conditions. It cannot measure a person's total potential, character, creativity, practical judgment, knowledge in every field, or future life. Its meaning stays tied to the assessment and its intended uses.
“This score is higher than those of about 84 percent of the age based norm group on this assessment.”
“This person will learn every subject faster than 84 percent of people and is more capable in every setting.”
IQ tests sample defined kinds of performance, commonly including verbal reasoning, visual or fluid reasoning, working memory, and processing speed, depending on the battery. Those tasks can provide useful evidence for clinical and educational questions. They do not directly test persistence on a six month project, musical interpretation, ethical judgment, manual skill, or knowledge that the battery never asks about.
Scores are also shaped by both biological development and experience. Language exposure, education, health, stress, and access to the test format can affect performance. The relationship between inherited variation and environment is studied using ideas also seen in biology's treatment of variation and inheritance, but a population level finding cannot identify a single cause for one person's score.
Predictions from a score are probabilities, not fates. A result may correlate with some academic outcomes, yet people with the same percentile can choose different goals, receive different instruction, and develop different expertise. Good decisions use the score only for purposes supported by evidence from that test.
Automated score reports deserve the same care. Software can retrieve norms and calculate conversions through systems like software interfaces between services, but accurate arithmetic does not guarantee a valid interpretation. The program still needs the correct test edition, age norms, scoring rules, and context. A polished output cannot repair unsuitable input.
A percentile is a position, not a verdict
The safest interpretation keeps the claim narrow: an IQ percentile reports where a standardized score falls relative to a defined norm group. It is useful because it translates an unfamiliar score scale into rank, but it remains one estimate from one assessment context.
For a common scale with mean 100 and standard deviation 15, remember the main landmarks: 100 is the 50th percentile, 115 is about the 84th, 85 is about the 16th, and 130 is about the 98th. Use the specific test's manual or professional report when precision affects a real decision.
The takeaway: Translate IQ into percentile only after checking the scale and norm group. Read percentile as the percentage at or below the score, keep the confidence interval in view, and never turn a comparative rank into a claim about an entire person.
A careful reading asks five plain questions: Which score is this? Which people formed the comparison group? How uncertain is the estimate? What abilities did the test sample? What decision is the score being used to support? If those answers are missing, the percentile may look precise while saying much less than it seems.