What is the average IQ score?
The average IQ score is 100 on most modern intelligence tests. That number is the center of an age-based reference group, not a count of questions answered correctly. Knowing how the scale works lets you interpret ranges, percentiles, and the uncertainty around any result.
IQ stands for intelligence quotient, but a modern IQ score is usually a standard score. Test developers give a set of tasks to a carefully selected sample, called the norm group. They then build a scale that places the group average at 100. A person who scores 100 performed near the center of comparable people in that norm group.
The comparison is usually age based because performance on many cognitive tasks changes during childhood and across adulthood. A 10-year-old is compared with other 10-year-olds, not with university students. An adult is scored against the adult norms specified by that test. This makes 100 carry the same basic meaning at different ages: performance near the reference group's center.
100 is a reference point. It does not mean 100 correct answers, 100 percent, or a fixed quantity of intelligence inside a person.
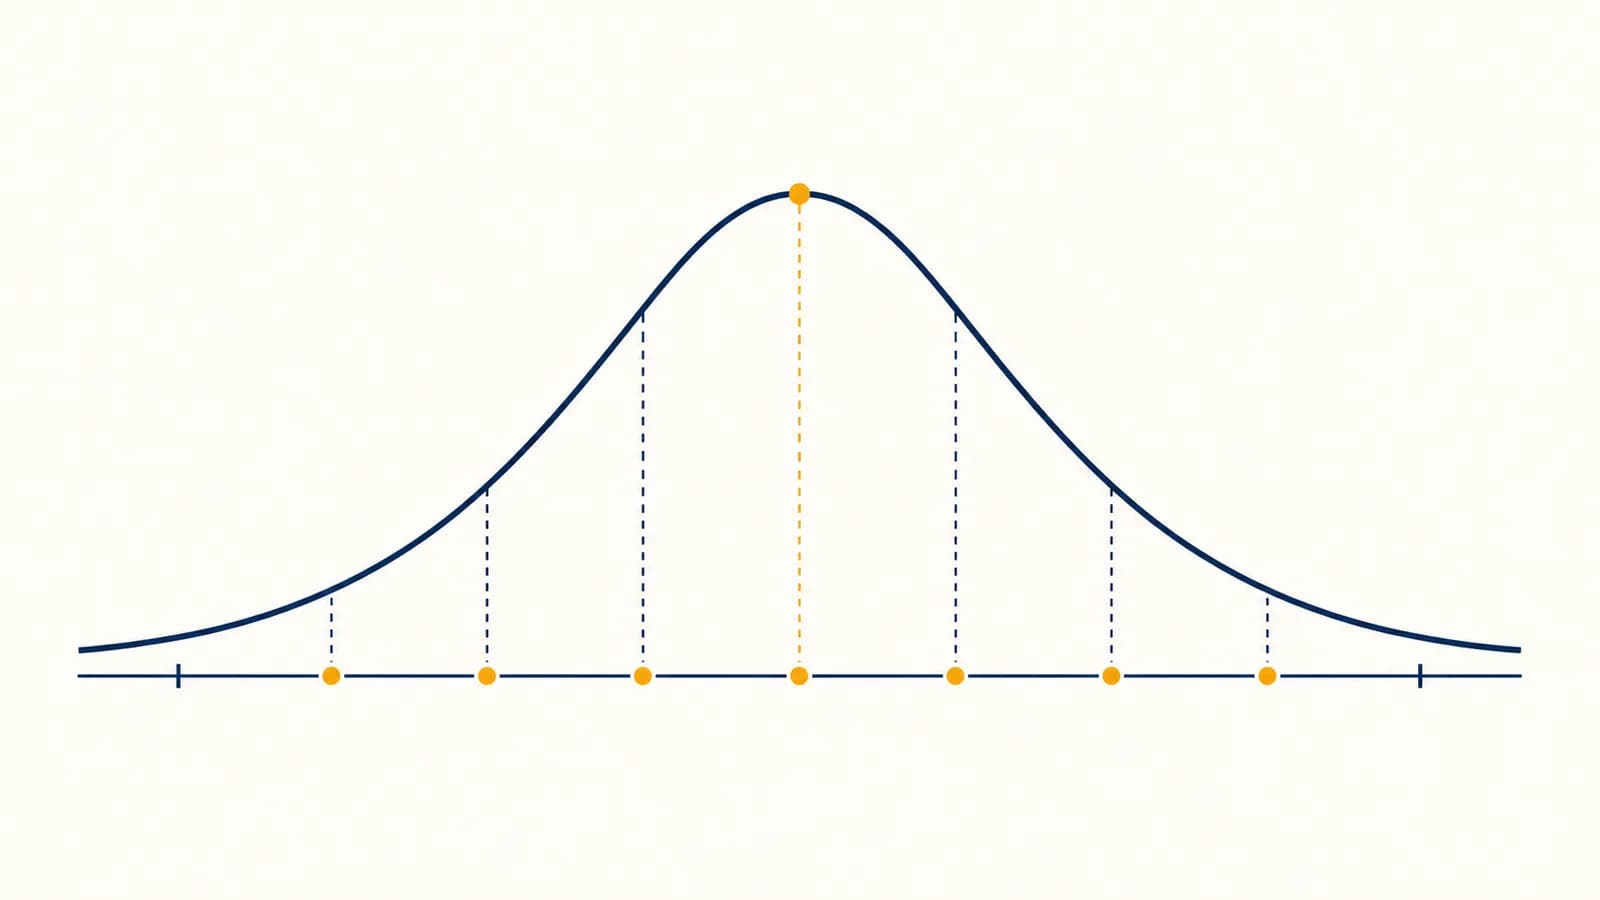
The American Psychological Association's Dictionary of Psychology says the mean is customarily 100 and that slightly more than two thirds of scores fall within 15 points of it. That pattern comes from the scale commonly used for major IQ tests: a mean of 100 and a standard deviation of 15.
Why is the average fixed at 100?
The average is fixed at 100 because IQ scores are converted from raw performance onto a common scale. Test publishers choose 100 as the mean, then use the spread of norm-group results to show how far each score lies above or below that mean.
A raw score might be the number of items solved or points earned across several tasks. On its own, it says little. Fifteen correct answers could be exceptional on one test form and ordinary on another. The norm table supplies the missing comparison by showing how people of the same age performed under the same rules.
The standard deviation describes spread. On the common 15-point scale, a score of 115 is one standard deviation above 100, while 85 is one standard deviation below. A score of 130 is two standard deviations above the mean. This spacing is defined by the scoring scale.
Many IQ distributions are designed to approximate a bell-shaped normal curve. In a perfect normal distribution, the mean, median, and most common value meet at the center. Real norm data need not form a flawless curve, so official percentile tables from the test manual are more authoritative than a quick calculation.
The normal curve is a model, not a law of nature. Its ideas of center, spread, and percentile belong to probability and statistical models, and they also appear in exam grading, medical reference ranges, and quality control.
How does a test turn answers into an IQ score?
A standardized test turns answers into an IQ score by following fixed administration rules, calculating raw scores, comparing them with age norms, and combining scaled subtest results. Each conversion must come from that test's manual because different batteries use different tasks and tables.
The examiner follows the same wording, time rules, starting points, and stopping rules used during standardization.
Correct responses, completion times, and item credits are scored according to the manual rather than personal judgment.
Raw results are located in the table for the person's age and converted to scaled subtest scores.
Specified subtests are combined and converted into an overall score or a narrower index score.
The mathematics can be represented with a z score, which counts standard deviations from a mean. Publishers may use more complex models and exact lookup tables, but the simple conversion shows why 100 and 15 appear.
Suppose a raw score is 48, the age-group mean is 40, and the raw-score standard deviation is 8. Then , so the illustrative IQ is .
This worked example explains the scale, but it cannot score a real test. A real battery may transform individual subtests first, weight or combine them according to its design, and then use a composite table. Copying a formula from one instrument to another would break the intended comparison.
Standard conditions matter because the norm comparison assumes similar testing circumstances. Noise, unclear instructions, a faulty screen, or an unrecorded timing change can alter performance. In a digital test, the design lessons behind clear interfaces built with HTML and CSS help explain why legible text, stable layouts, and usable controls are measurement issues, not decoration.
What do scores above and below 100 mean?
Scores above 100 indicate performance above the norm-group mean, and scores below 100 indicate performance below it. The distance from 100 matters more than the direction alone, while a percentile states the share of the reference distribution at or below a score.
Under the normal-curve model, about 68 percent of scores fall within one standard deviation of the mean, which is the interval from 85 to 115 on this scale. About 95 percent fall within two standard deviations, from 70 to 130. These are properties of the mathematical normal distribution, rounded for readability.
A percentile is not a percentage correct. In an ideal normal distribution, 115 is near the 84th percentile because it is one standard deviation above the mean. That means performance was as high as or higher than roughly 84 percent of the reference distribution. It does not mean 84 percent of questions were correct.
This is the share of available item points earned. It depends on the test's difficulty and may not be reported to the test taker.
This locates performance relative to the norm group. The exact conversion comes from the instrument's norm tables.
Labels such as average, high, or very low can differ between publishers and institutions. A boundary can also exaggerate a tiny difference. Scores of 114 and 115 are only one point apart even if a particular chart places them in different named bands. Read the number, percentile, confidence interval, and test manual together.
Different tests can also use different scales. The 100-and-15 system is common, not universal. Before comparing two reported scores, check the test name, edition, norm group, scale, and date. A numerical match does not prove that the tests measured the same mix of abilities.
How precise is an IQ score?
An IQ score is an estimate with measurement error, not an exact reading. A professional report should interpret a confidence interval around the obtained score and consider conditions that may have affected performance. Small differences between scores often do not support a meaningful conclusion.
Any performance measure varies. A person may misunderstand an instruction, lose concentration, guess an item, or work a little faster on another day. The test itself samples a limited set of tasks. Reliability statistics describe how consistently the instrument measures, and the standard error of measurement converts that reliability into score units.
For a purely hypothetical score of 110 with a standard error of 3, an approximate 95 percent interval is , or about 104 to 116 after rounding.
The standard error in that example is chosen to show the arithmetic. It is not a universal value. The actual interval must use the test manual, the relevant composite, the person's age group, and the confidence method specified by the publisher.
A student obtains 108 on one assessment and 112 on another. It is tempting to claim a four-point improvement. If the confidence intervals overlap and the tests used different tasks or norms, the evidence may support only a stable general range. An examiner would inspect the full profiles and testing conditions before interpreting the change.
Practice can also raise performance on familiar item types. Repeating the same or a closely related test may measure memory for procedures along with the intended ability. Publishers set retest guidance for this reason. Language fluency, hearing, vision, motor demands, fatigue, medication effects, and anxiety can matter as well. Their importance depends on the person and the tasks.
An online result without disclosed norms is not interpretable as a clinical IQ score. A polished graph cannot replace a suitable norm sample, standardized administration, reliability evidence, and qualified interpretation.
Online quizzes can still be enjoyable reasoning exercises. The problem begins when a site reports a precise IQ without explaining its comparison group or methods. Precision in the display does not create precision in the measurement.
What does an IQ test measure?
An IQ test measures performance on a selected set of cognitive tasks under standardized conditions. Depending on the battery, those tasks may sample verbal reasoning, visual problem-solving, working memory, processing speed, and learned knowledge. The composite summarizes that sample, not the whole person.
Abilities tend to show positive correlations: someone who performs well on one kind of cognitive task is somewhat more likely to perform well on others. Test batteries use several subtests partly to sample this shared pattern and partly to show differences among narrower abilities. The exact structure varies by instrument.
Matrix and sequence problems ask a person to infer rules, a style of reasoning that also appears in binary logic and computer circuits. The resemblance has limits. A human brings language, attention, prior learning, and strategies to the task; the score does not show that a mind operates like a literal digital circuit.
A comparison with a defined norm group, evidence about performance on sampled abilities, and one part of an educational or clinical assessment.
A person's creativity, judgment, persistence, practical skill, character, future choices, or value.
IQ tests can predict some kinds of academic learning and training performance, but prediction is not destiny. Education, health, opportunity, instruction, motivation, and specific knowledge affect what a person can do in a real setting. A broad composite can also hide a profile with stronger and weaker subtests.
The biology of cognition is more detailed than one total. Attention, perception, memory, language, and motor systems depend on interacting brain and body processes. Lessons on how human body systems work provide the foundation for seeing why sleep, illness, sensory access, and development can affect a testing session.
In high-stakes assessment, a qualified professional combines test data with the reason for referral, personal history, observations, and other evidence. Decisions about support or diagnosis should not rest on a naked number. The required evidence depends on the applicable professional standards and local rules.
Can an IQ score change?
An IQ score can change because measured performance and the comparison scale can both change. Development, education, health, practice, testing conditions, and ordinary measurement error may affect a result. Updated norms can also alter the reported score even when underlying task performance is similar.
Age norming does not freeze a person in place. It asks how that person's current performance compares with peers of the same age. A child may gain many raw points over several years yet keep a similar IQ because peers gained at a similar rate. An adult's profile may shift as knowledge and processing demands change.
Population test performance has also changed across generations, a pattern called the Flynn effect. A 2014 meta-analysis published in Psychological Bulletin combined 285 studies conducted since 1951 and estimated an average rise of 2.31 standard-score points per decade. The authors also found substantial variation across studies, so that average is not a correction to apply blindly to one person.
Researchers continue to study why generational patterns differ by country, period, age, and type of task. Schooling, health, test familiarity, family size, and more abstract daily environments have all been proposed as contributors. No single explanation covers every result. Recent gains, plateaus, or declines in particular samples do not erase the need for current local norms.
A change is most convincing when it is larger than expected measurement error, appears on appropriate comparable tests, and fits other evidence. Comparing an unsupervised web quiz with a professional assessment does not meet that standard. Comparing scores from different editions also requires care because tasks and norms may have changed.
An IQ score is a comparison, not a verdict
The number 100 answers a narrow and useful question: where did this performance fall relative to the appropriate norm group? It does not give a percentage of intelligence, a permanent rank, or a complete account of someone's capacity to learn and solve problems.
Good interpretation starts by naming the test and edition, checking the norm group, reading the percentile and confidence interval, and examining the subtest pattern. It then adds context: age, language, access needs, testing conditions, and the purpose of the assessment. Each step prevents the bare score from claiming more than the evidence supports.
For a casual result, treat the number as feedback on a set of puzzles. For a school, clinical, or legal decision, ask for the full professional report and the rules used to interpret it. A responsible report states limits as clearly as findings.
The takeaway: The average IQ score is 100 because modern tests define their norm-group mean that way. Most use a 15-point standard deviation, so distance from 100 describes relative standing. The score still needs its test name, norms, percentile, confidence interval, and real-world context.