What do IQ score ranges actually mean?
IQ score ranges show how a person's performance on a standardized intelligence test compares with the performance of same-age people in the test's norm group. Most modern IQ tests set the average IQ at 100. By the end, you will be able to read common IQ classifications, convert a score into an approximate percentile, and understand why no score is a diagnosis or a complete measure of intelligence.
An IQ score is not the number of questions answered correctly. That raw total has little meaning by itself because a 10-year-old and a 30-year-old should not be compared with the same raw benchmark. Test publishers collect results from a carefully selected norm group, divide that group by age where appropriate, and convert each raw result to a standard score.
This conversion makes the score comparative. An IQ of 100 means performance near the center of the relevant norm group, not perfect performance and not 100 percent intelligence. A score of 115 means performance one standard deviation above that center on the common scale. It does not mean the person is 15 percent more intelligent than someone who scored 100.
The familiar number is usually a Full Scale IQ, a composite built from several tasks. A full evaluation may also report narrower index scores for abilities such as verbal comprehension, visual spatial reasoning, working memory, fluid reasoning, or processing speed. The names and combinations depend on the test. A composite can hide meaningful differences among those areas.
Which IQ classifications are commonly used?
Common IQ classifications place scores into broad descriptive bands around 100, but the labels are not universal. A useful general table runs from extremely low below 70 to extremely high at 130 and above. The test's own manual and report take priority over any generic chart.
| IQ score | Approximate percentile span | Common neutral description |
|---|---|---|
| 130 and above | 98th and above | Extremely high |
| 120 to 129 | 91st to 97th | Very high |
| 110 to 119 | 75th to 90th | High average |
| 90 to 109 | 25th to 74th | Average |
| 80 to 89 | 9th to 24th | Low average |
| 70 to 79 | 2nd to 8th | Very low |
| 69 and below | About 2nd and below | Extremely low |
The percentile spans are rounded, and scores at a boundary should not be treated as fundamentally different. A score of 109 and a score of 110 can land in different named bands even though the one-point gap is smaller than ordinary measurement uncertainty. Classification words are convenient summaries, not natural walls in human ability.
Labels vary by test and edition. One report may use “very high,” another may use “superior,” and an older report may contain language that current professionals avoid. Quote the score, test, date, and confidence interval before relying on a label.
These bands are also uneven in percentile coverage. The average band contains roughly half of the norm group, while the extremely high band covers only the thin upper tail. Equal intervals in IQ points do not contain equal numbers of people because scores cluster near the mean.
How does standard deviation locate a score?
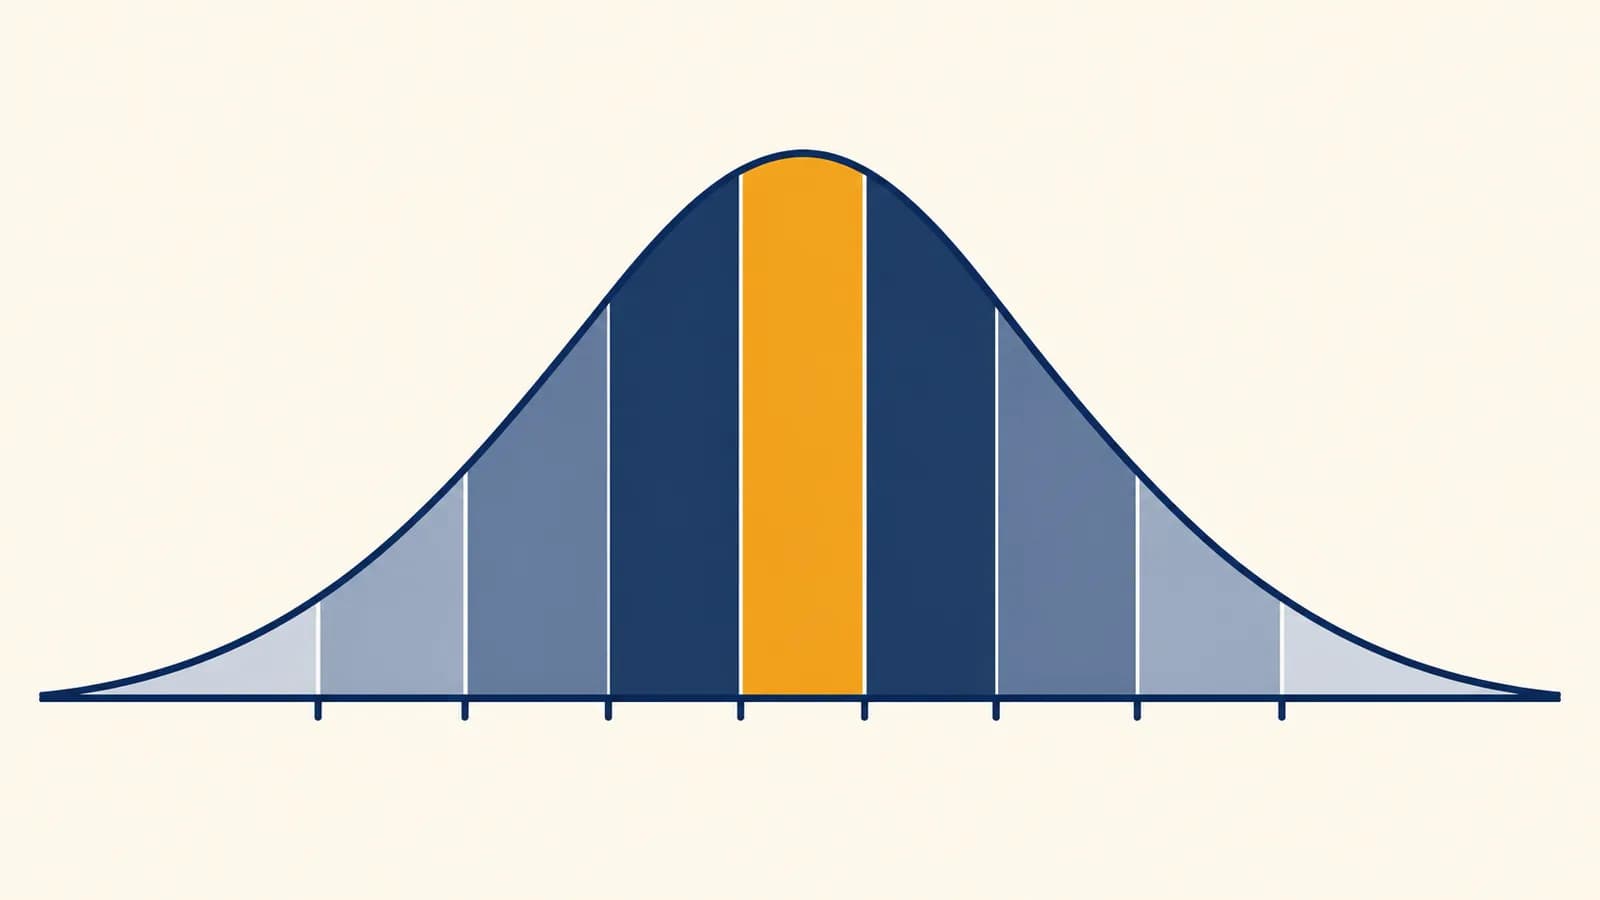
Standard deviation measures how far scores typically spread around the mean. On the common IQ scale, 15 points equal one standard deviation, so 115 is one standard deviation above 100, 85 is one below it, and 130 is two above it.
The calculation uses a z score, which expresses distance from the mean in standard deviation units. This is the same statistical idea used to compare measurements with different units. The relevant foundations sit within mathematics and quantitative reasoning, especially averages, distributions, and standardized values.
For an IQ of 130: , so the result is two standard deviations above the mean.
If the norm distribution is close to a normal bell curve, a familiar statistical rule gives useful approximations. About 68 percent of scores fall within one standard deviation of the mean, which is 85 through 115. About 95 percent fall within two standard deviations, which is 70 through 130. These are model-based proportions, not counts from every testing session.
Modern scores are sometimes called deviation IQs because they describe deviation from an age norm. They are not literal quotients of mental age divided by chronological age, despite the name “intelligence quotient.” That older calculation belongs to the history of testing, not the interpretation of a current standardized score.
Why is a percentile not the same as an IQ percentage?
A percentile rank tells what percentage of the norm group scored at or below a result; it does not state the percentage of questions answered correctly or the percentage of intelligence a person possesses. An IQ of 100 is near the 50th percentile, while 130 is near the 98th.
The conversion is curved because the distribution is curved. Moving from 100 to 115 crosses from about the 50th percentile to about the 84th. Another 15 points, from 115 to 130, reaches about the 98th. Both moves are one standard deviation, but they cross different shares of the population.
A raw performance measure. If a person solves 24 of 30 items, the percentage correct is . It does not account for item difficulty or age norms.
A relative position in a norm group. The 80th percentile means the score was as high as or higher than about 80 percent of that group. It does not mean 80 percent correct.
Percentile ranks are often easier to explain in school meetings and reports because they answer a direct comparison question. IQ points are easier for statistical work because the scale has equal standard deviation units. This resembles the distinction between a raw return and a benchmark comparison in financial mathematics: the reference group changes what a number communicates.
For precise conversion, psychologists use the tables supplied with the test rather than a generic online converter. Standardized scores are built from actual norming procedures, and their tails may not follow a perfect mathematical curve. Rounded percentile labels can also make nearby scores appear identical.
How reliable is one IQ score?
One IQ score is an estimate with measurement uncertainty, not an exact reading of a fixed quantity. Professional reports usually pair the obtained score with a confidence interval, a range designed to contain the person's underlying level of performance at a stated confidence rate under the test model.
Every test samples behavior. It uses a limited set of tasks on one day, under particular conditions. Attention, fatigue, anxiety, pain, hearing, vision, language background, familiarity with testing, and motivation can affect performance. Standard administration and suitable accommodations reduce avoidable distortion, but they cannot turn an estimate into a perfectly exact measurement.
A report gives a Full Scale IQ of 116 and a confidence interval of 110 to 122. The responsible reading is that the observed result sits in the high-average area, while plausible values cross into the next descriptive band. Treating 116 as exact would claim more precision than the report supports.
The width of a confidence interval depends on the test's reliability and the confidence level used. A wider interval expresses more uncertainty. The exact interval must come from that test's scoring system. It should not be guessed by adding a standard number of points to every IQ score.
Retesting can produce a different result. Some change is ordinary measurement variation. Practice may help on familiar task formats, while changed health or attention may hinder performance. For this reason, a psychologist also checks the testing history, the interval between assessments, behavior during the session, and consistency across subtests.
This pattern matters in learning. Someone may reason well through a new problem but need more time to hold instructions in mind or produce written work. A broad score cannot show the exact source of difficulty. Tasks involved in learning variables, loops, and machine-like logic, for example, draw on several abilities rather than a single mental dial.
What does an IQ test measure, and what does it miss?
A well-designed IQ test measures performance on selected cognitive tasks that sample reasoning, acquired knowledge, memory, and processing skills. It does not directly measure character, curiosity, creativity, wisdom, practical judgment, effort over months, or a person's value. Its meaning stays tied to the test and comparison group.
Test tasks are chosen because performance across them tends to correlate, allowing psychologists to estimate broad cognitive ability and narrower abilities. A verbal task may ask how ideas relate. A visual task may require selecting a missing pattern. A working-memory task may require holding and rearranging information. Speeded tasks measure accurate work under a time limit.
A structured comparison of sampled cognitive performance with an appropriate norm group, interpreted alongside index scores, confidence intervals, history, and observations.
A person's future, moral worth, motivation, emotional skill, occupational ceiling, or ability in every setting. It also cannot identify the biological cause of a performance pattern.
An intelligence test observes answers and response patterns. It does not scan neurons or inspect the behavior of cells and their structures. Brain development and health affect cognition, but moving from a test score to a biological explanation requires other evidence, such as medical history, neurological examination, or appropriate clinical testing.
Culture and language matter because no task is free of context. Test developers try to reduce irrelevant demands and norm the instrument for its intended population. An evaluator still has to ask whether the language, schooling, disability access, and cultural experience make the comparison fair. A technically valid test can be misused with the wrong person or for the wrong purpose.
Prediction is statistical, not personal destiny. Cognitive test performance can contribute useful evidence about academic learning and some kinds of training or work. Yet opportunities, instruction, health, interests, persistence, social support, and specific knowledge also shape outcomes. A group-level association cannot tell an individual exactly what will happen.
How are low and high scores used in real decisions?
Schools and clinicians use IQ results as one part of decisions about support, assessment, and educational planning. A low or high score may prompt closer investigation, but responsible decisions combine test data with daily functioning, achievement, development, records, observations, and the rules of the relevant program.
For intellectual developmental disorder, often called intellectual disability, a low IQ score alone is not enough. The American Psychiatric Association describes the condition using limitations in intellectual functioning and adaptive functioning with onset during the developmental period. Adaptive functioning covers conceptual, social, and practical skills used in ordinary life.
Severity is based on adaptive functioning, not an IQ band. Current diagnostic practice focuses on the support a person needs in conceptual, social, and practical life. Older charts that assign “mild,” “moderate,” or “severe” disability from IQ alone should not be used as diagnosis guides.
A score around two standard deviations below the mean can be evidence of a significant limitation in intellectual functioning. On a scale with mean 100 and standard deviation 15, that reference point is around 70. Measurement error means clinicians consider an approximate range rather than a rigid cliff. They also require evidence about adaptive functioning and developmental onset.
At the high end, some schools or organizations use scores near the 98th percentile as one route into gifted services, often corresponding to an IQ around 130 on this scale. There is no single worldwide definition of giftedness. Local programs may use different cutoffs, achievement evidence, teacher input, work samples, or demonstrated need for advanced instruction.
Admission to a program, diagnosis, accommodations, and learning plans ask different questions. The evidence must fit the question.
Confirm the test, edition, age norms, language, date, testing conditions, confidence interval, and evaluator's qualifications.
Compare the Full Scale IQ with index scores, achievement, adaptive functioning, history, and observations. Look for strengths as well as needs.
Use the current policy or diagnostic standard. Do not substitute a generic internet range for the criteria that govern the decision.
Legal and school systems differ by place, so a score that qualifies someone for one service may not qualify them elsewhere. A test result can inform a decision without making it automatically. If access to support is at stake, request the written criteria and the full evaluation, not only the summary number.
A score is evidence, not an identity
IQ ranges are most useful when they organize evidence without pretending to describe a whole person. Read the standard score beside its percentile, confidence interval, index pattern, test conditions, and purpose. Then connect the result to the person's actual learning and daily functioning.
For a quick interpretation, start with the scale. If the mean is 100 and the standard deviation is 15, locate how many 15-point steps the score sits above or below 100. Use the report's own classification, then translate the score into an approximate percentile. Keep boundary labels loose because measurement uncertainty can cross them.
Next, ask what was measured. Full Scale IQ combines tasks, while index scores describe narrower parts of the performance. Check for unusually large differences, signs that speed or language affected results, and any caution written by the evaluator. A score without its report loses the context needed to interpret it well.
The takeaway: An IQ score is a norm-based estimate of selected cognitive performance. The common scale centers on 100 with a standard deviation of 15, but classifications are descriptive ranges, percentiles are relative positions, and real decisions require evidence beyond one number.
Use the result to ask better questions: Which tasks were strong? Which were difficult? Does the pattern match school, work, and daily life? What support or challenge would help next? Those questions turn a classification into useful information while keeping the limits of the measurement in view.