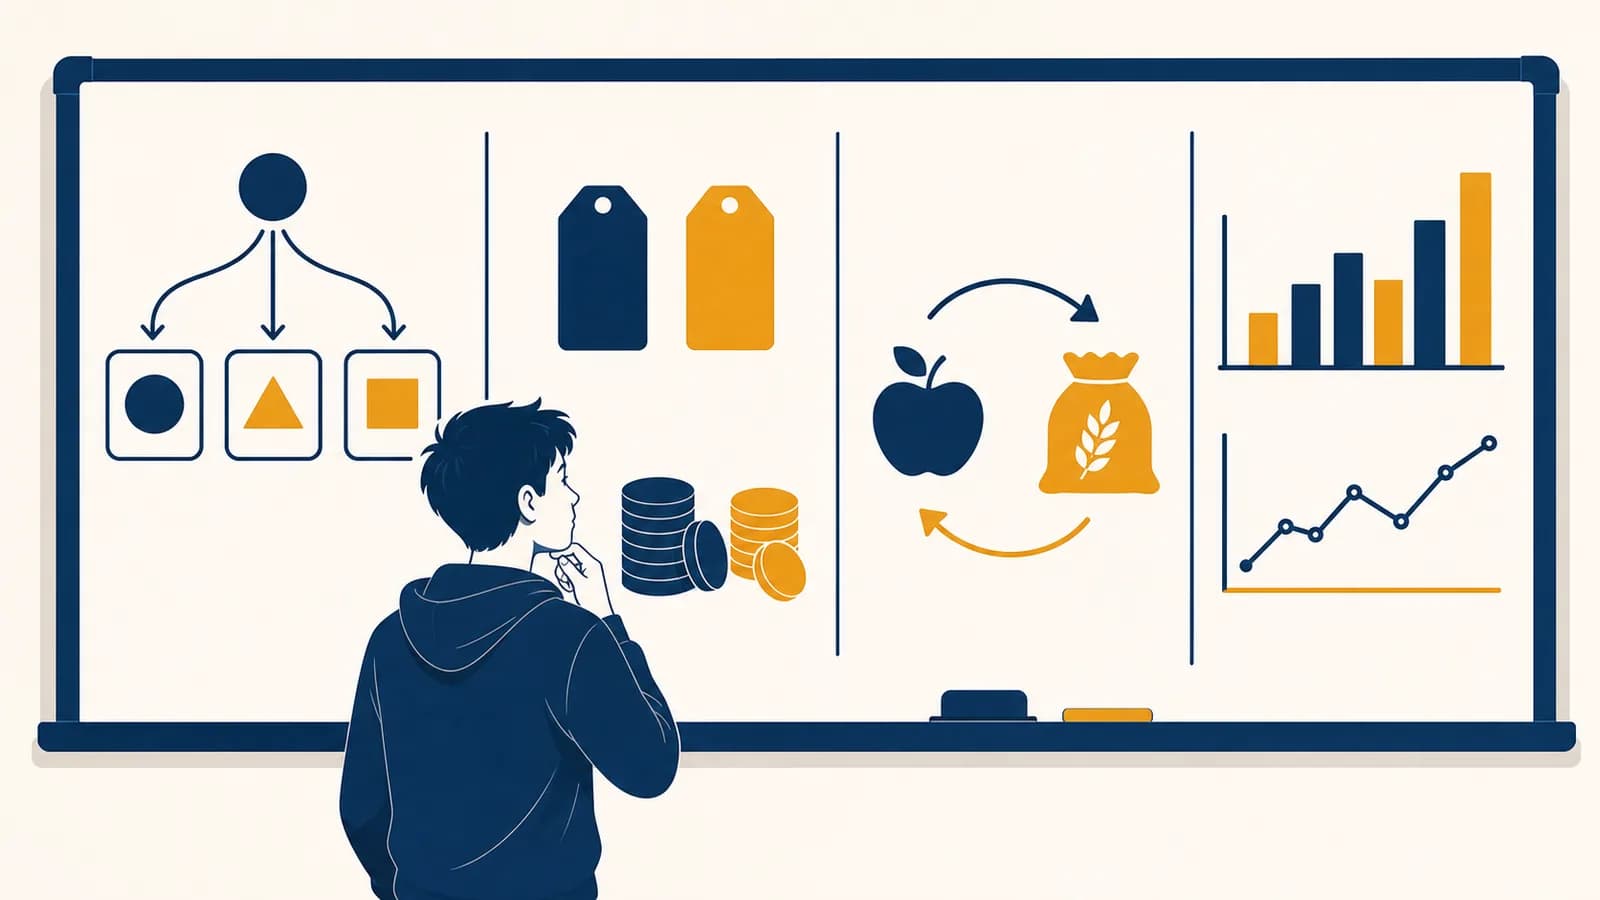
What does economics actually study?
Economics studies how people and institutions choose under scarcity, and how those choices shape production, exchange, prices, income, and well-being. Learning the basics of economics lets you explain everyday decisions, read economic news more carefully, and test claims about markets and government policy.
Scarcity does not mean that everything is rare or that everyone is poor. It means time, labor, land, equipment, and materials have alternative uses. A school can spend an extra dollar on laboratory supplies or library books, but it cannot spend that same dollar twice. A student can work an evening shift or study during those hours, but cannot fully do both at once.
This makes economics a study of choices and their consequences. Microeconomics examines decisions by households, workers, and firms, along with particular markets. Macroeconomics examines economy-wide outcomes such as total production, unemployment, inflation, and economic growth. The two levels interact. A central bank's interest rate decision can change what a family pays on a loan, while millions of household purchases help determine total spending.
Scarcity creates trade-offs. Choosing one use of a limited resource means giving up another possible use.
Economists build models to isolate these mechanisms. A model is a simplified account of reality, not a miniature copy of everything. A demand curve, for example, holds other relevant influences constant so that the relationship between price and quantity can be examined. Good economic reasoning keeps track of what the model includes, what it leaves out, and what evidence could prove its prediction wrong.
How does opportunity cost reveal the real price of a choice?
Opportunity cost is the value of the best alternative you give up when you choose. It includes money, but it can also include time, convenience, enjoyment, or future income. The relevant cost is the next best option, not every rejected option added together.
Suppose a concert ticket costs $30, and attending also requires four hours that you could use for a paid shift earning $12 per hour. Ignore taxes and travel for this worked example. The opportunity cost is the $30 ticket plus $48 of forgone pay, so attending costs you $78 in money and lost earnings. If your best alternative was studying rather than working, the cost would instead be the value you place on that study time.
The visible payment is $30, while the income sacrificed is $48.
A student has two free hours before an exam. One more hour of revision is expected to improve the result more than the first hour did not, because the first hour covered the weakest topics. The student compares the benefit of another hour with the best alternative use of that hour, then chooses at the margin.
Marginal thinking means comparing the extra benefit of one more unit with its extra cost. A bakery does not ask only whether baking bread is generally profitable. It asks whether producing one more batch will add more revenue than cost. The pattern behind many such choices is explained by how marginal utility falls as consumption rises: the first glass of water when thirsty usually helps more than the fourth.
Why do prices change in a market?
A market price changes when buyers' willingness to purchase or sellers' willingness to produce changes. Demand describes quantities buyers would purchase at different prices, while supply describes quantities sellers would offer. Their interaction tends to move the market toward a price where planned purchases equal planned sales.
The law of demand says that, other things held constant, a higher price usually reduces quantity demanded. A lower price usually increases it. This is a movement along a demand curve. The whole curve shifts when another influence changes, such as income, tastes, the number of buyers, expectations, or the prices of related goods.
Supply works in a similar but opposite direction. A higher market price often makes extra production worthwhile, so quantity supplied rises, other things held constant. The supply curve can shift because of wages, material costs, technology, taxes, weather, expectations, or the number of sellers.
Consider a small market that sells 100 sandwiches each lunch period at $5. A nearby office opens, adding customers. At the old price, buyers now want 130 sandwiches while shops still prepare 100. The shortage gives sellers a reason to raise prices and make more sandwiches. Some buyers then choose alternatives. The new equilibrium depends on how strongly buyers and sellers respond, not simply on the size of the initial shortage.
The product's own price changes, so buyers move to another point on the same demand curve.
Income, preferences, expectations, or another outside influence changes, so the entire demand curve shifts.
Elasticity measures responsiveness. Demand is price elastic when a percentage change in price causes a larger percentage change in quantity demanded. It is price inelastic when quantity changes by a smaller percentage. Buyers tend to respond more when close substitutes exist or when they have time to adjust. This is why the same price increase can sharply reduce sales of one product but barely change purchases of another.
When do markets coordinate well, and when do they fail?
Markets coordinate well when prices reflect relevant costs and benefits, participants can make informed choices, and competition limits market power. They can fail when transactions affect outsiders, information is uneven, public goods invite free-riding, or a seller can restrict competition.
A competitive price carries information. It signals how much buyers value another unit and how costly sellers find producing it. When a drought makes a crop harder to grow, reduced supply raises its price. Consumers conserve or switch products, while producers have a reason to seek new sources. No single person needs to issue every instruction.
An externality appears when an action imposes a cost or benefit on someone outside the transaction. Factory pollution can harm nearby residents even though they did not buy or sell the factory's product. Because the market price may omit that harm, too much pollution can result. A tax tied closely to the external cost can make the producer face more of the social cost. Regulation or enforceable limits may work better when damage is hard to price.
Public goods create another problem. They are non-excludable, meaning it is difficult to prevent nonpayers from benefiting, and non-rival, meaning one person's use does not substantially reduce another's. National defense is a standard example. Each person can hope that others will pay, creating a free-rider problem and too little private provision.
Market power also changes outcomes. A sole seller may raise price by restricting output, while competing sellers risk losing customers if they do the same. Information matters too. A used-car seller usually knows more about a vehicle than a buyer. Inspections, warranties, disclosure rules, and reputation can reduce this gap, though none makes information perfect.
How do specialization and trade create gains?
Specialization and trade can increase total output when people, firms, or countries focus on tasks with lower opportunity costs and exchange the results. The relevant comparison is comparative advantage, which depends on what each producer gives up, rather than who can produce the most.
Suppose Arun can make either 12 loaves or 6 cakes in a day. Bea can make either 8 loaves or 8 cakes. For Arun, one cake costs 2 loaves. For Bea, one cake costs 1 loaf. Bea therefore has the comparative advantage in cakes. Arun gives up half a cake for each loaf, while Bea gives up one cake, so Arun has the comparative advantage in loaves.
| Producer | Daily maximum loaves | Daily maximum cakes | Opportunity cost of one cake |
|---|---|---|---|
| Arun | 12 | 6 | 2 loaves |
| Bea | 8 | 8 | 1 loaf |
If Bea specializes more in cakes and Arun more in loaves, they can trade at a rate between their opportunity costs. A price of 1.5 loaves per cake can benefit both. Bea receives more than the 1 loaf she gives up to make a cake, while Arun pays less than the 2 loaves he would give up to make one himself. The full logic of specialization through comparative advantage also explains why an efficient producer can still gain by trading with a less productive one.
Gains from trade are not the same as equal gains. Opening trade can lower consumer prices and expand export industries while exposing some workers and firms to new competition. Economists therefore separate efficiency from distribution. A policy can increase total income and still impose concentrated losses. Retraining, temporary income support, or place-based investment may change who bears the adjustment, but each policy also has costs and limits.
What do GDP, inflation, and unemployment tell us?
Gross domestic product measures final production within an economy, inflation measures the general rise in prices, and unemployment measures joblessness among people participating in the labor force. Together they describe major conditions, but none is a complete score of social welfare.
GDP can be measured by adding spending on final goods and services, incomes earned in production, or value added at each stage. In principle, these approaches reach the same total because one person's spending becomes another person's income. Counting only final output avoids double counting. The flour bought by a bakery is an intermediate good; the finished bread sold to a household is final output.
Consumption plus investment plus government purchases plus exports minus imports equals total domestic output.
Nominal GDP values output at current prices. Real GDP adjusts for price changes, making production across periods more comparable. GDP still omits unpaid household work, says little by itself about income distribution, and does not subtract every environmental loss. It measures market production, not happiness or fairness.
Inflation is a sustained increase in the general price level, not simply one product becoming expensive. A price index tracks the cost of a defined basket or set of outputs. If an index rises from 200 to 206, the calculated inflation rate is 3 percent because the increase of 6 is 3 percent of 200. Individual households can experience different changes because they buy different mixtures of goods and services.
Unemployment statistics distinguish people without jobs who are seeking work from those outside the labor force. The unemployment rate can fall because job seekers find work, but it can also fall if discouraged people stop seeking and leave the measured labor force. Employment, labor-force participation, wages, hours, and vacancies add needed context.
A worker's pay rises from $20 to $21 per hour, an increase of 5 percent.
If the relevant price level also rises by 5 percent, the worker's purchasing power is approximately unchanged.
How do governments and central banks influence the economy?
Governments influence total demand through spending and taxes, while central banks influence credit conditions through monetary policy. Both can steady severe fluctuations, but their effects arrive with delays, depend on expectations, and can create costs such as higher debt or inflation.
Fiscal policy covers government spending, taxation, and borrowing. During a downturn, higher public spending or lower taxes can increase demand. A construction project directly pays workers and suppliers, who may then spend part of that income. During high inflation caused by excessive total demand, lower spending or higher taxes can reduce pressure, though elected governments may resist unpopular restraint.
Monetary policy commonly works through interest rates and financial conditions. When a central bank raises its policy rate, borrowing usually becomes more expensive. Some households postpone mortgages or large purchases, and some firms reject investments that no longer promise enough return. Demand cools, which can reduce inflation pressure. The same chain can also slow hiring and output.
The central bank changes the short-term rate it controls or targets.
Banks and markets adjust loan rates, deposit rates, asset prices, and exchange-rate decisions.
Households and firms reconsider borrowing, saving, consumption, and investment.
Changes in total demand affect production, employment, and eventually inflation.
Neither policy can produce unlimited output by creating more spending. An economy's productive capacity depends on workers, skills, capital, resources, technology, and institutions. If demand grows faster than the capacity to supply goods and services, prices tend to rise. Supply-side policies aim to expand capacity, but education, infrastructure, competition reform, and research usually take time to affect production.
How can you test an economic claim?
Test an economic claim by defining its terms, identifying the proposed cause, checking the comparison, and looking for evidence that could contradict it. Separate statements about what is happening from judgments about what ought to happen, since facts alone cannot choose social values.
Start with a claim such as, “A higher minimum wage reduces employment.” Which workers, which wage change, which time period, and compared with what? A simple model says a binding wage floor can reduce the quantity of labor demanded. Employers might also absorb lower profit, raise prices, improve productivity, accept fewer vacancies, or face lower staff turnover. The actual size and mixture of effects require evidence.
Specify the variable, group, place, and period instead of relying on a vague word such as “better.”
Explain each link connecting the proposed cause to the predicted result.
Ask what would probably have happened without the policy or event.
Look for other changes that could produce the same pattern and for evidence against your preferred explanation.
Correlation alone does not establish causation. Ice cream sales and sunburn cases may rise together because hot, sunny weather affects both. In policy research, the missing comparison is the counterfactual: what would have happened to the same people at the same time without the policy. Since that state cannot be observed directly, researchers use randomized trials when suitable, natural experiments, comparison groups, and statistical controls.
Networks can matter too. A disruption at one supplier may spread through connected firms, while a transport improvement may make several routes cheaper. The computer science of networks, routes, and graph algorithms offers a precise language for nodes, links, shortest paths, and bottlenecks that also appear in economic systems.
Positive statements describe or predict, such as “this tax will reduce demand.” Normative statements make value judgments, such as “this tax is fair.” Evidence can test the predicted reduction and show who pays. It cannot decide fairness without a standard, such as equal treatment, ability to pay, or responsibility for harm. Honest disagreement often survives because people assign different weights to valid goals.
Economic thinking turns headlines into testable claims
Economic thinking replaces quick reactions with disciplined comparisons. It asks what is scarce, which alternative is sacrificed, how incentives change behavior, who gains or loses, and what evidence supports the proposed cause. Those questions make personal choices and public arguments easier to examine.
A report that rent rose after a housing rule does not by itself prove that the rule caused the increase. You would check supply, demand, building costs, population changes, interest rates, the timing of the rule, and a credible comparison. A claim that trade “helps the economy” also needs distributional detail. Total gains can coexist with serious losses for a particular town or occupation.
The takeaway: Economics is a method for comparing constrained choices. Use opportunity cost for alternatives, supply and demand for market adjustment, macroeconomic indicators for economy-wide conditions, and evidence for causal claims.
The subject gains value as foundations connect. Marginal choices build market outcomes. Market outcomes contribute to national production and employment. Policy alters incentives, while institutions determine which costs count and whose claims are enforced. The high school economics subject hub develops these foundations into models you can apply, question, and revise when the evidence changes.
A good economic answer rarely ends with “more” or “less.” It identifies the margin, the time period, the affected groups, the likely response, and the best available alternative. That discipline does not remove disagreement. It makes disagreement specific enough to investigate.