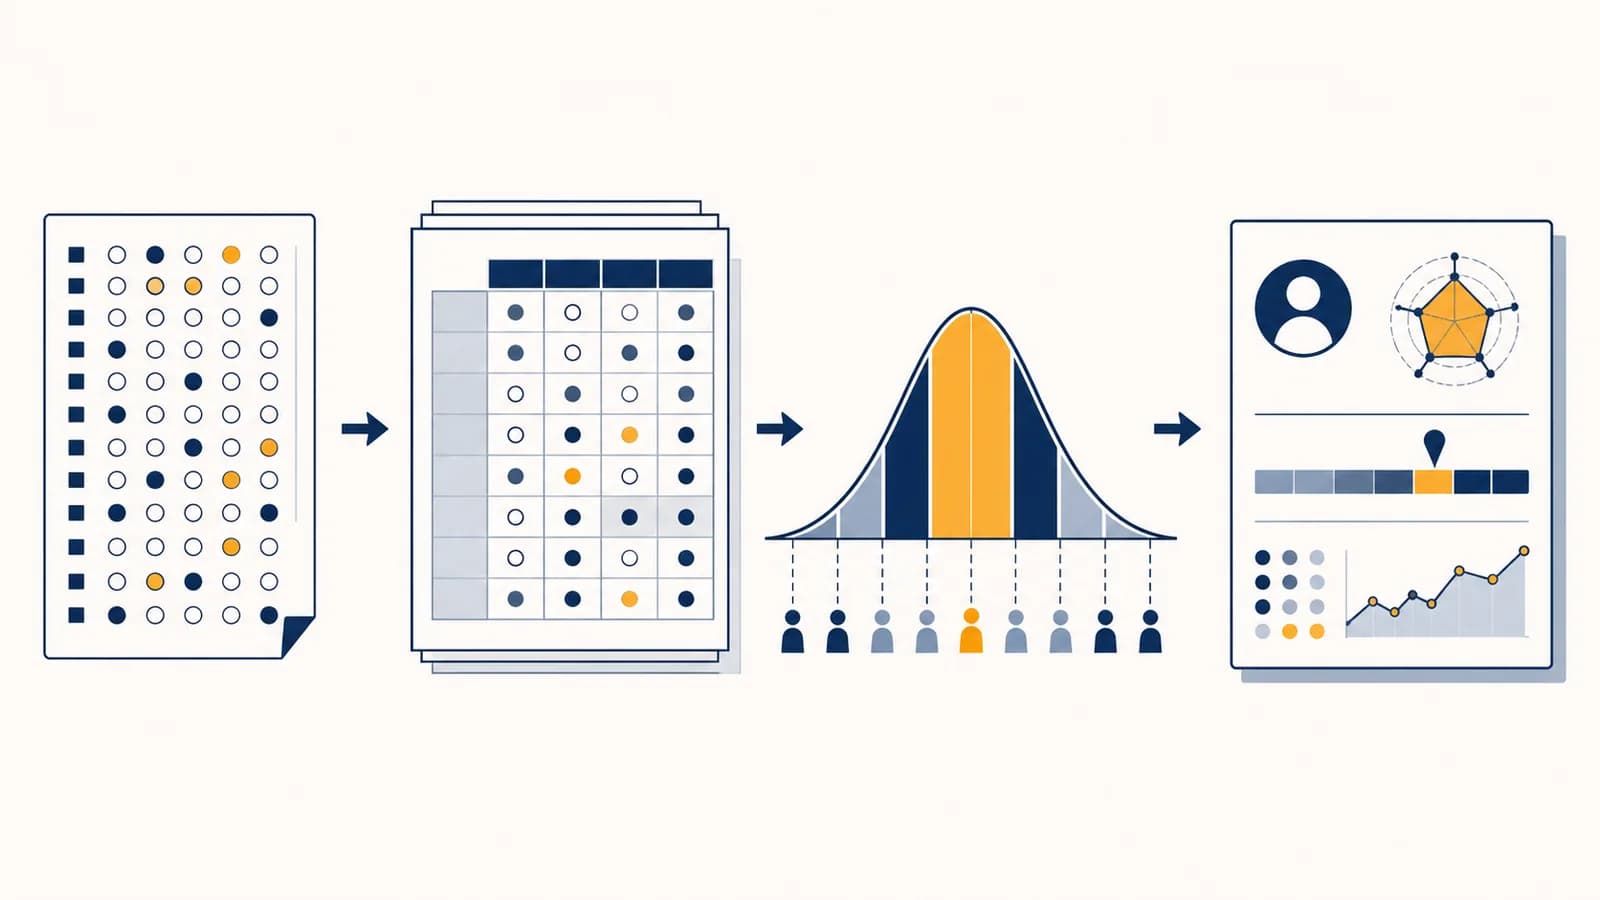
IQ scores compare performance with an age-matched norm group
An IQ score is a standardized comparison between a person's test performance and the performance of people of the same age in a reference sample. IQ tests are scored by turning answers into raw points, converting those points with age-based norm tables, and combining several task scores into composites. By following that chain, you can read a score report without mistaking an IQ number for a percentage correct, a fixed quantity of intelligence, or a diagnosis.
The familiar scale has a mean of 100. On many widely used clinical tests, including the Wechsler scales, the standard deviation is 15. A score of 115 is therefore one standard deviation above the norm-group mean, while 85 is one standard deviation below it. This describes relative position, not how many questions someone answered correctly.
A norm group is assembled to represent the population for which a test is intended. Test developers administer the tasks under standard conditions, divide the sample into age bands where needed, and map performances onto a common scale. Good norms cover relevant ages and demographic groups, but no sample is a perfect miniature of a whole country. The test manual should explain who entered the sample and when the data were collected.
This relative design also explains why age matters. A teenager and an adult may earn the same raw total yet receive different standardized scores because each is compared with the appropriate peers. On a task that develops rapidly in childhood, even children separated by several months may use different norm tables.
How does a correct answer become an IQ score?
A correct answer first earns raw credit under a scoring rule. The examiner then converts each subtest's raw total into an age-adjusted scaled score. Selected scaled scores are added, and another norm table converts that sum into an index score or Full Scale IQ.
The scoring rule depends on the task. A vocabulary response may receive no credit, partial credit, or full credit according to examples in the manual. A visual puzzle may be scored for accuracy. A processing task may count correct work completed within a time limit, with specified rules for errors. Examiners record responses because judgment calls must be checked against the manual rather than improvised.
Apply the task's exact rules for accuracy, quality, timing, starting points, stopping points, and any permitted prompts.
Add the credited responses within each subtest. A raw total has meaning only for that task and form.
Find the scaled score assigned to that raw total for the examinee's age band.
Add the required scaled scores, then use the test's composite table to obtain indexes and, when supported, a Full Scale IQ.
A composite is not usually calculated by taking an ordinary average of the printed subtest scores. The test publisher specifies which subtests enter each composite and supplies a lookup table based on the normative data. Substitutions may be allowed in limited circumstances, but only under the manual's rules.
The conversions depend on ratios and proportional reasoning, but the real tables need more than a simple proportion. Raw-score distributions can be lopsided, age bands can differ, and one extra raw point may not have the same effect everywhere on a task. The norm table preserves the position observed in the reference sample.
A standard score is a location, not a percent correct
A standard score tells how far a result lies from the norm-group mean on a defined scale. It does not say that a person got that percentage of items right. It also differs from a percentile rank, which reports the proportion of peers who scored lower.
The word quotient is historical. An older method divided an estimated mental age by chronological age and multiplied by 100: . Modern clinical tests generally use deviation scores based on norm-group position instead. Their IQ numbers should not be read as literal mental-age ratios.
The basic idea can be expressed with a z score. If a score distribution has mean and standard deviation , the standardized distance of a score is:
If , , and , then .
In the idealized normal-curve model, an IQ-type scale can be written as . This equation explains the scale, but it is not permission to turn any classroom score into IQ. A defensible conversion requires a standardized instrument, a suitable norm group, and the publisher's scoring procedure.
A student answers 36 of 40 items correctly, so the percent correct is . This reports performance on those items.
A person receives IQ 115 after norm-based conversion. This reports a position one standard deviation above the scale mean, not 115 percent correct.
Percentile ranks are nonlinear because a normal distribution has many observations near the middle and fewer near the ends. Under the normal-curve approximation, IQ 100 is at the 50th percentile. IQ 115 is near the 84th percentile, and IQ 130 is near the 98th. Moving 15 IQ points does not add a fixed number of percentile points.
These percentile values are rounded mathematical approximations based on a normal distribution with mean 100 and standard deviation 15. A publisher's table may give a slightly different rank because real norm data are not a perfectly smooth bell curve and reported scores are discrete.
What do the subtests and index scores measure?
Modern clinical IQ tests sample several kinds of cognitive work rather than asking one kind of puzzle repeatedly. Subtests are grouped into indexes such as verbal comprehension, visual spatial reasoning, fluid reasoning, working memory, or processing speed, with names and groupings varying by test.
One task might ask a person to explain word meanings. Another might require arranging visual information, detecting a rule, holding digits in mind, or matching symbols quickly. Each task samples a narrow performance under controlled conditions. The index combines related samples, and the Full Scale IQ combines a specified selection across broader areas.
Scores belong to a named test and edition. An IQ of 110 is interpretable only with information about the instrument, norm group, administration, and confidence interval.
The Wechsler Intelligence Scale for Children, Fifth Edition, provides a useful public example. Its sample interpretive report states that primary and secondary subtests use a scale with mean 10 and standard deviation 3. Its primary index scores and Full Scale IQ use mean 100 and standard deviation 15. Those are two different reporting scales inside the same assessment.
Profiles can contain genuine variation. Someone may reason well on untimed visual tasks yet work slowly on a timed symbol task. Another person may know many words but struggle to hold several pieces of information in immediate memory. The pattern can help a qualified examiner form and test explanations, but a high or low subtest does not prove a medical condition by itself.
Combining many measures is familiar in data science that turns raw numbers into decisions. The hard part is not addition. It is deciding what the variables represent, how much uncertainty they contain, and which conclusion the evidence can support. A composite can summarize a profile, but it can also hide a large spread among its parts.
Why is an IQ score reported with a range?
Every observed IQ score contains measurement error, so a confidence interval gives a defensible range for the underlying score. Its width depends on the test's precision and the chosen confidence level. A report should treat the interval as part of the result, not fine print.
Small changes can occur because of item sampling, attention, fatigue, anxiety, illness, distractions, and ordinary variation in performance. The standard error of measurement estimates how much observed scores tend to vary because measurement is imperfect. Test manuals use their reliability evidence to calculate it, often with methods tailored to the score and age group.
A report lists a Full Scale IQ of 111 with a 95 percent confidence interval of 106 to 116. The responsible reading is that 111 is the point estimate and 106 to 116 is the test's stated range under its confidence procedure. It is false precision to treat 111 as an exact measurement that permanently separates the person from someone who scored 109.
The numbers in this scenario come from Pearson's public WAIS-5 sample score report, which states that its confidence intervals are calculated using the standard error of estimation. Different composites in that same sample have different interval widths. Precision belongs to each score, not to the word IQ in general.
A 95 percent confidence procedure has a technical repeated-sampling meaning: across many comparable assessments, intervals constructed by that procedure are intended to contain the relevant true scores 95 percent of the time. It does not mean a person's intelligence moves randomly anywhere in the printed interval, and it does not make every possible interpretation 95 percent certain.
Score differences also need uncertainty. A five-point gap between two indexes may look meaningful on paper but still be common once the reliability of both measures and their correlation are considered. Clinical reports may test whether a difference is statistically unusual and may show how often a gap of that size appeared in the norm sample. Size, uncertainty, and context all matter.
Why can the same person receive different IQ scores?
IQ scores can differ because tests sample different abilities, use different norm groups, set different ceilings, and contain measurement error. Performance also changes with health, language, motivation, practice, and testing conditions. A difference is evidence to investigate, not automatic proof that intelligence changed.
Two reputable tests may emphasize somewhat different tasks. Even scales that both report a mean of 100 and standard deviation of 15 are not interchangeable, just as two maps can use the same units while drawing different boundaries. A short online puzzle set samples less behavior than a full individually administered battery and may have weak or undisclosed norms.
Any quiz that returns a number on a 100-centered scale has measured IQ, and a repeat score must reveal a true gain or loss.
The number is defensible only if the tasks, norms, administration, scoring, reliability, and evidence for the intended interpretation are sound. Repeat results must be judged with measurement error and practice in mind.
Standardization makes conditions comparable. Instructions, time limits, allowable prompts, start and stop rules, and room conditions should follow the manual. Changing a user interface can change what a task demands, which is why interface design that accounts for real users matters in digital assessment. A tiny target, input lag, or confusing control may add a motor or usability burden that was never meant to be scored.
Language and access needs require careful judgment. Translating a verbal item on the spot may alter its difficulty. A motor impairment may depress a task that requires quick marking. A visual impairment may block access to picture material. An accommodation can improve access, but an alteration can also change the construct. The examiner must know which modifications are permitted and how they affect interpretation.
Norms also age. If population performance on certain tasks shifts over generations, comparison with an old reference sample can change the resulting score. Publishers periodically renorm major tests for this reason and others. A newer edition may also revise items and composite structure, so a score difference across editions cannot be assigned to one cause without further evidence.
What can an IQ score support, and what can it not prove?
An IQ score can describe performance on a standardized set of cognitive tasks relative to a defined norm group. It can contribute to educational or clinical decisions when combined with history, observations, achievement data, and functioning in daily life. Alone, it cannot explain a person.
An assessment may help investigate learning difficulties, intellectual disability, cognitive strengths, effects of injury, or eligibility questions. Each use has its own rules and required evidence. For example, intellectual disability is not established by an IQ cutoff alone. Evaluation also considers adaptive functioning, which concerns conceptual, social, and practical demands in everyday life, as well as developmental history.
- Supported: comparing performance with the test's age norm group under standardized conditions.
- Supported with care: examining a pattern of index scores alongside other records and measures.
- Not supported: ranking human worth, moral character, creativity, wisdom, or future effort with one number.
- Not supported: diagnosing a condition from a score without the other evidence required for that diagnosis.
Validity attaches to an interpretation and use, not to a test in the abstract. A tool may have good evidence for estimating certain cognitive abilities in one population and poor evidence for screening job applicants in another. The joint Standards for Educational and Psychological Testing, published by major US research and professional associations, treats validity, reliability, fairness, and intended use as connected responsibilities.
Labels such as average or very high are communication aids, not natural boundaries in the mind. Pearson's guidance for the WAIS-5 says its qualitative descriptors are suggestions and are not evidence-based categories. Two scores on opposite sides of a label boundary may be practically indistinguishable once their confidence intervals are considered.
Statistical literacy helps people challenge false certainty. The broader subject of mathematics used to describe evidence includes distributions, sampling, uncertainty, and conditional claims. Those ideas turn a score report from a verdict into what it should be: a structured piece of evidence.
A responsible reading follows the score back to its evidence
A responsible reader asks which test produced the score, who supplied the comparison group, which tasks formed the composite, how precise the estimate is, and whether the administration was valid. Those questions preserve what the score can say while blocking claims that outrun the measurement.
Start with the test name and edition. Check the person's age at testing and the norms used. Read the index scores before treating the Full Scale IQ as a complete description. Look for a confidence interval, notes about behavior or accommodations, and an explanation of any unusually large differences within the profile.
The takeaway: An IQ score is the end of a measurement pipeline, not a direct count of intelligence. Raw responses become age-normed subtest scores, selected subtests become composites, and every reported number carries uncertainty and limits on its use.
The most useful interpretation connects the number to the decision at hand. A school plan may need achievement tests and classroom evidence. A clinical question may need medical history and adaptive-functioning information. A research comparison may need representative sampling and consistent administration. The IQ score can contribute evidence in each setting, but the decision depends on more than the score.
Read the scale, the percentile, and the confidence interval as different answers to different questions. The scale gives standardized distance from the mean. The percentile gives relative rank in the norm group. The interval reports measurement precision. Keeping those meanings separate is the simplest protection against both exaggerating an IQ result and dismissing useful information it genuinely contains.